Category: STEM (Science, Technology, Engineering and Mathematics)
ORIGINAL
Entropy pelican optimization algorithm (epoa) based feature selection and deep autoencoder (dae) of heart failure status prediction
Selección de funciones basada en el algoritmo de optimización de entropía pelícano (epoa) y autoencodador profundo (dae) de predicción del estado de insuficiencia cardíaca
Ms. T. Sangeetha1 ![]() *, Dr. K. Manikandan1
*, Dr. K. Manikandan1 ![]() *, Dr. D. Victor Arokia Doss1
*, Dr. D. Victor Arokia Doss1 ![]() *
*
1Department of Computer Science, PSG College of Arts & Science. Coimbatore - 641014, Tamil Nadu, India.
Cite as: Sangeetha MT, Manikandan DK, Arokia Doss DDV. Entropy pelican optimization algorithm (epoa) based feature selection and deep autoencoder (dae) of heart failure status prediction. Salud, Ciencia y Tecnología - Serie de Conferencias. 2024; 3:761. https://doi.org/10.56294/sctconf2024761
Submitted: 29-12-2023 Revised: 16-03-2024 Accepted: 11-05-2024 Published: 12-05-2024
Editor: Dr. William
Castillo-González ![]()
ABSTRACT
Introduction: heart Failure (HF) is a complicated condition as well as a significant public health issue. Data processing is now required for machine and statistical learning techniques while it helps to identify key features and eliminates unimportant, redundant, or noisy characteristics, hence minimizing the feature space’s dimensions. A common cause of mortality in cases of heart disease is Dilated Cardiomyopathy (DCM).
Methods: the feature selection in this work depends on the Entropy Pelican Optimization Algorithm (EPOA). It is a recreation of pelicans’ typical hunting behaviour. This is comparable to certain characteristics that lead to better approaches for solving high-dimensional datasets. Then Deep Autoencoder (DAE) classifier has been introduced for the prediction of patients. DAE classifier is employed to compute the system’s nonlinear function through data from the normal and failure state.
Results: DAE was discovered to not only considerably increase accuracy but also to be beneficial when there is a limited amount of labelled data.Performance metrics like recall, precision, accuracy, f-measure, and error rate has been used for results analysis.
Conclusion: publicly available benchmark dataset has been collected from Gene Expression Omnibus (GEO) repository to evaluate and contrast the suitability of the suggested classifier with other existing methods.
Keywords: Heart Failure (HF); Dilated Cardiomyopathy (DCM); Entropy Pelican Optimization Algorithm (EPOA); Gene Expression Omnibus (GEO); Deep Autoencoder (DAE); FS (Feature Selection).
RESUMEN
Introducción: la insuficiencia cardíaca (IC) es una afección complicada y un importante problema de salud pública. El procesamiento de datos ahora es necesario para las técnicas de aprendizaje estadístico y automático, mientras ayuda a identificar características clave y elimina características sin importancia, redundantes o ruidosas, minimizando así las dimensiones del espacio de características. Una causa común de mortalidad en casos de enfermedad cardíaca es la miocardiopatía dilatada (MCD).
Métodos: la selección de características en este trabajo depende del Algoritmo de optimización de entropía pelícano (EPOA). Se trata de una recreación del comportamiento cazador típico de los pelícanos. Esto es comparable a ciertas características que conducen a mejores enfoques para resolver conjuntos de datos de alta dimensión. Luego se introdujo el clasificador Deep Autoencoder (DAE) para la predicción de pacientes. El clasificador DAE se emplea para calcular la función no lineal del sistema a través de datos del estado normal y de falla.
Resultados: se descubrió que DAE no solo aumenta considerablemente la precisión, sino que también es beneficioso cuando hay una cantidad limitada de datos etiquetados. Para el análisis de resultados se han utilizado métricas de rendimiento como recuperación, precisión, exactitud, medida f y tasa de error.
Conclusión: se recopiló un conjunto de datos de referencia disponibles públicamente del repositorio Gene Expression Omnibus (GEO) para evaluar y contrastar la idoneidad del clasificador sugerido con otros métodos existentes.
Palabras clave: Insuficiencia Cardíaca (HF); Miocardiopatía Dilatada (DCM); Algoritmo de Optimización de Entropía Pelícano (EPOA); Ómnibus de Expresión Genética (GEO); Codificador Automático Profundo (DAE); FS (Selección de Funciones).
INTRODUCTION
The prevalent cause for mortality is cardiovascular illness. Cardiovascular disorders remain to impact over 500 million individuals worldwide, accounting for around one-third of all fatalities. One of the cardiovascular diseases with an elevated risk for mortality as well as other uncomfortable symptoms and a poor standard of life is heart failure. It restricts regular physical and social activity and causes a range of emotional and bodily distress. The most prevalent reason for heart transplantation and a major contributor to heart failure is dilated cardiomyopathy (DCM). A homogeneous phenotypic classification that utilizes anomalies in Heart structure and function is used to make the diagnosis of DCM. But it is a disorder with a variety of aetiologies (genetic, clinical, concomitant, arrhythmia), clinical symptoms, and response to therapy.(1,2) DCM is linked to an estimated 20 % 5-year mortality rate.(3) The terminology and medical category for DCM still are inconsistent. This shortcoming prevents clinicians from diagnosing and treating these clinically diverse heart failure symptoms in an efficient way.
Heart disease treatment options include genetic testing. It entails collecting an element of a person’s DNA and examining it for alterations (also known as pathogenic mutations) that potentially result in genetic heart disease. There are three different categories into which DNA microarrays’ main applications can be divided. For starters, scientists can identify genes that are differentially expressed in heart illness from normal and irregular cardiac rhythms by comparing expression levels among predetermined groups of samples. A second use is class prediction, which necessitates classifying the sample’s members (for example, to determine the patient’s heart rate). It is important to identify subgroups that have similar characteristics. Techniques for removing the informative genes linked to heart disease thus become essential and crucial. Although machine learning-based prediction models are increasingly being used in healthcare,(4,5) physicians still find it difficult to depend on these algorithms in clinical practice.(6) Multiple forms of distinct or multi-functional large-scale data sets, including transcriptomic, genomic, and demographic data of patients, have been used for the categorization of diseases by machine learning (ML).
It gets challenging to train different ML models with a huge gene characteristic. In order to conquer the high input dimensions and relatively limited sample sizes, feature selection has become a standard approach in the analysis of HD (High-Dimensional) data, like the EG (Expressed Gene) information used in this investigation.(7,8,9) Filter, wrapper, and embedding techniques can be used to do classic feature selection tasks. The filter approach resolves the optimal feature ranking using statistical calculation mode rather than a machine learning model. It moves quickly but inaccurately. A particular feature evaluator or machine learning model is used by the wrapper technique. Using the heuristic search technique, it is always seeking the best feature combination. The best feature subset for the feature classifier can be discovered using the fitness function as the evaluator’s return value. The wrapper technique’s drawbacks still are high temporal complexity and local optimization. The feature selection and machine learning process are skilfully combined in the embedded approach, which then produces the feature subset using the model’s weight parameters. This approach’s effectiveness is dependent on the ML technique, and some frameworks cannot produce weight parameters.
The majority of present hybrid FS approaches either infer the link among the samples using the data model or provided that each sample is evenly distributed. Data from DNA microarrays differs from data from natural sources. Their main characteristics (genes) have complex connections on one another rather than being completely independent. Due to the issues of these methods, optimization is the procedure for choosing the best answer from a series of potential ones.(10) The two main categories of methods to tackling optimization problems are deterministic and stochastic techniques. Algorithms for population-based optimization are among the most effective ones among stochastic approaches. In this paper, Entropy Pelican Optimization Algorithm (EPOA) is introduced to imitate the pelican’s hunting style and tactics. In order to get a subset of characteristics that have minimal redundancy, great robustness, and practical significance, EPOA has been established. In order to forecast individual heart tissues and the way they are related to heart tissues, Deep Autoencoder (DAE) classifier has been developed. The Gene Expression Omnibus (GEO) repository’s publicly accessible benchmark data have been considered to evaluate and compare the suitability of the suggested hybridization approaches to the other available techniques.
Literature review
Schiano et al.(11) suggested a ML method using Protein-Protein Interaction (PPI) network. Investigating transcriptome properties of individual’s cardiac tissue required combining a novel computational strategy with a bioinformatics framework for differential expression. Real-time PCR quantitative validation was used. Using tissue samples from transplants, initial studies identified particular DCM-related genes recognized to play a role in cardiomyopathies. A surprising link among Left Ventricular End-Diastolic Diameter (LVEDD), and NEAT1 as determined by severity classification (NYHA-class III), was discovered when these expression patterns were combined with clinical features. Conclusions: Employing the ML method, initial genes that can swiftly result in several molecular targets associated with DCM clinical characteristics were discovered.
Zhu et al.(12) explored genes having immune-related characteristics in DCM cases. The ‘limma’ tool in R software was utilized to find Differentially EG (DEG) following data preprocessing. Gene Ontology (GO) and Kyoto Encyclopedia of Genes and Genomes (KEGG) route enriched studies followed to establish the biological roles of the DEG.xCell were used to calculate the patterns of stromal and immunological cells. According to Protein-Protein Interaction (PPI) network analysed by STRING web tool and Cytoscape program, functional modules and hub genes were discovered. Hub genes were the subject of a correlation investigation among immune cell subsets.
Chen et al.(13) performed data analysis in GSEA (Gene Set Enrichment Analysis) and PPI detections. The feature gene selection was supported by the Support Vector Machine (SVM), and Least Absolute Shrinkage and Selection Operator (LASSO) methods, and the effectiveness of the prediction model was assessed using ROC curve evaluation. RNA transcripts (CIBERSORT) and Non-negative Matrix Factorization (NMF) approach have both been developed for molecular typing and forecasting immune cell infiltration, respectively.
Xie et al.(14) suggested GNN (Graph Neural Network) based FS method. For creating graph-structured data, the suggested technique makes advantage of the in-depth connections among characteristics and the Pearson Correlation Coefficient (PCC). To combine node data on graph structured data, data aggregation and dissemination processes using graph neural networks are used. The spectral clustering technique groups the redundant features. Later, each clustering sub-cluster is subjected to the action of a feature ranking aggregation framework utilizing 8 feature evaluation techniques. The suggested technique can successfully get rid of extra features. The algorithm’s result is more accurate and stable in its classifications, which could assist in the selection of prospective biomarkers.
Kang et al.(15) suggested a 2-Stage Teaching-Learning-Based Optimization (TS-TLBO) technique to enhance the classification of bioinformatics info performance. In order to efficiently decrease the search space, both noisy and possibly informative features are selected during the selection reduction stage. The educator and the pupil with adaptive self-education along FS difficulties in the subsequent comparative self-learning stage to improve the exploitation capabilities. To increase the excellence, an opposition-based education technique is also used to develop early answers. Through vigorously modifying the mutation rate in accordance with the educator convergence ability, a self-adaptive mutation method is provided to enhance search performance.
Yang et al.(16) suggested three DCM datasets (GSE9800, GSE3585, and GSE84796) from the Gene Expression Omnibus (GEO) database were eliminated from the dataset and batches were combined into a single dataset. Weighted Gene Co-Expression Network Analysis (WGCNA) in R software was utilized to screen DEG and analyse the relationships among gene co-expression elements and medical characteristics. Common Gene (CG) refers to any DEG from the combined dataset that intersected with the significant module genes. The CGs’ enrichment study was carried out using the dataset. Utilizing Cytoscape 3.8.2 software, the CGs PPI network was displayed, and hub gene was discovered.
Jiang et al.(17) identified DEG on two DCM gene expression datasets, and performed Disease Ontology (DO), GO, and GSEA functional optimization to find possible routes. To identify diagnostic markers, the SVM- Recursive Feature Elimination (SVM-RFE) technique and the LASSO method were utilized. A tool called Cell Type Analysis Tool (CIBERSORT) has been developed to analyse immune cell infiltration.
Dauda et al.(18) suggested hybridized dimension reduction using Deep Neural Networks (DNN), Genetic Algorithms (GA), and Boruta Algorithms (BA). Numerous genes are related to the forecasting of cardiac rhythm individuals, which is one of the remaining inquiries by computing and biological scientists. To identify the key genes, five different micro-array data on cardiac disorders have been considered. In order to obtain highly differentially expressed genes and improve both prediction of parameters and model interpretation, three distinct sets of two-way hybrids among BA and NN (BANN), and BA and DNN (BADNN) and GA- DNN (GADNN) were introduced.
Chen et al.(19) suggested microarray probe-sequence re-annotation of long non-coding RNA (lncRNA) expression profiles connected to DCM and non-failing hearts. An extremely strong association between a module and DCM status was found by weighted gene co-expression network analysis. Apart from ZNF571-AS1, all hub lncRNA localization to the cytoplasm was expected. Hub lncRNA may behave as competitive endogenous RNA (ceRNA) as a potential pathogenic mechanism for DCM. Effectively replicated in a different external dataset based on outcomes. Hub lncRNA was located in human aortic smooth muscle cells using RNA-Fluorescence In Situ Hybridization (FISH), and quantitative RT-PCR results verified that it was up-regulated in DCM individuals. The data suggested the possible involvement of eight candidate lncRNAs in DCM illness, possibly through competing endogenous RNA (ceRNA) crosstalk.
Song et al.(20) suggested the R package’s Non-Negative Matrix Factorization (NMF) clustering to choose candidate genes for determining the DCM subgroup. The GEO database was utilized to obtain raw data on DCM and healthy heart tissue. The methods employed differential research, route enhancement, subtype identity, immunocytes infiltration, and single-cell RNA sequencing analysis. When it comes to immunological activation, heart failure in DCM, heparin sulphate (HS) is intimately correlated. Additional research was done on a molecular categorization of DCM using HS heterogeneity in DCM individuals.
Zhang et al.(21) suggested the WGCNA to find possible biomarkers and therapeutic targets. According to the Meta scape database, PPI networks of the important DEG. It was designed to investigate potential genes related with DCM and their dormant regulatory effects in both male and female patients. Hub genes in PPI networks, putative Transcription Factor (TF), microRNA, and highly enriched pathways were examined to determine the variations among female and male patients after the detection of critical DEG in an essential WGCNA module. Numerous important DEG have expression trends that are consistent with outcomes from earlier studies, demonstrating the validity of the database and data analysis findings.
PROPOSED METHODOLOGY
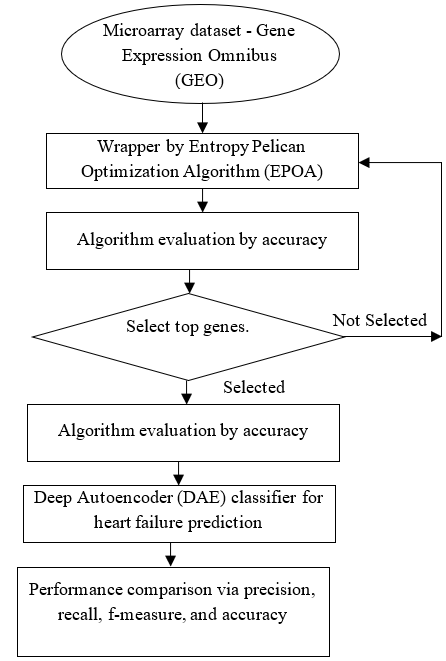
Figure 1. Flow diagram of proposed system
Here, Entropy Pelican Optimization Algorithm (EPOA) has been introduced for feature selection. This compares to several criteria that result in better approaches to solving high-dimensional datasets. Next, a Deep Autoencoder (DAE) classifier is used to forecast patients’ heart tissues and how that tissue is related to them. The Gene Expression Omnibus (GEO) repository’s publicly accessible benchmark data have been taken into account to evaluate and compare the suitability of the suggested hybridization approaches to current techniques.
Microarray dataset
Table 1 provides the outcomes of search in the NCBI GEO(9) database (https://www.ncbi.nlm.nih.gov/geo/) for RNA-seq research on DCM. The meta-analysis contained only research that used tissue models taken from the patients left ventricle.
|
Table 1. Summary of geo datasets for the meta-analysis |
|||
|
Dataset |
Platform |
Sample Size |
Human Heart Tissue |
|
GSE116250 |
Illumina HiSeq 2500 |
37 DCM 14 NF |
Left Ventricle |
|
GSE57344 |
Illumina HiSeq 2500 |
2 DCM 14 NF |
Left Ventricle |
|
GSE71613 |
Illumina HiSeq 2500 |
2 DCM 4 NF |
Left Ventricle |
From the European Nucleotide Archive website (https://www.ebi.ac.uk/ena), raw data (FASTQ files) were obtained. Low read count genes were excluded utilizing the filtering process of DESeq2 with the default values, utilizing the filter statistic is the average of standardized counts. Fisher’s united probability test for meta-analysis was carried out with the use of the Meta RNASeq(22) package. Using the equation (1), this method integrates the p-values for each gene from many studies.(22)
![]()
Fg has a 2S degree of freedom Chi-squared distribution when p-values are independent. Larger Fg and null hypothesis rejection is produced by smaller p-values. Where p-values were modified to account for Benjamini-Hochberg False Discovery Rate (FDR), the raw p-value derived for gene g in a differential analysis for study S can be denoted as Pgs. A statistically significant result was one where the modified p-value was less than 0,05. From the DEG list, genes whose expression patterns varied across different studies were eliminated.
Entropy pelican optimization algorithm (epoa)
Entropy Pelican Optimization technique (EPOA), a brand-new stochastic nature-inspired optimization technique, is presented for feature selection. It is a recreation of pelicans’ typical hunting behaviour. In EPOA, pelicans serve as search agents and look for food sources by selecting the best set of attributes from the dataset. The pelican can seize and consume target with the support of its long beak and huge pouch in its throat. This bird is sociable and frequently gathers in groups of lots of pelicans.(23) Each population member in population-based procedures is a possible answer for the best possible feature selection. Depending on where they are in the search space, every population member offers values for the best qualities. Equation (2) is employed to arbitrarily generate population members according to upper and lower bounds of the feature range.
![]()
Where lj is the jth lower bound and uj is the jth upper bound of the problem feature, xi,j is the value of the jth feature delivered by the ith candidate solution, m express problem features numbers, N express population members numbers, Xi,j is a random number within the inteval [0, 1].
Equation (3) uses a population matrix to recognize the pelican population members within the planned POA. The matrix columns reflect the feature range for the ideal solution, and each row indicates a sample from the gene dataset.

If Xi is the it pelican and X is the pelican population matrix. Each population member in the suggested POA serves as a pelican in the feature selection scheme for the gene dataset. As a result, depending on the potential solutions, the given problem’s OF (Objective Function) can be assessed. Equation (4) uses a vector to derive the values acquired for the OF.
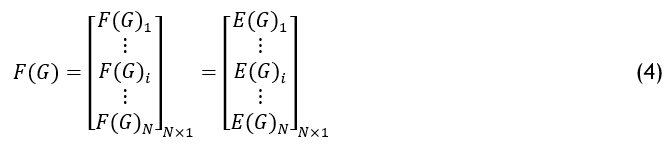
Here F is the fitness function vector and Fi is the OF value of the ith dataset. F is computed depending on the entropy range of the feature in the gene dataset.
Entropy is a system measurement. In the area of information, Shannon put out the concept of information entropy. Weight distribution could be accomplished by using information entropy. The better for a gene, the higher the entropy. Initially the definition of the uncertainty function shown in following:

Here P is related probability. Next, by computing the uncertainty function’s expectation, the information entropy can be measured.
![]()
Where G is the set of all possible genes in the dataset. The suggested EPOA updates the feature selection approach by imitating the strategies and actions used by pelicans to assault and pursue prey. The two part of hunting technique: (i) Reaching the target in the exploring phase. (ii) Water surface winging (exploitation phase).
Phase 1: Moving towards Prey (Exploration Phase)
The pelicans determine the prey location during the initial phase and subsequently fly in that direction. By simulating this pelican’s approach, researchers may scan the gene search space and demonstrate the suggested EPOA’s capacity to investigate a variety of search spaces. The crucial aspect of EPOA is prey’s gene position in the gene search space is generated randomly. Equation (7) details the pelican’s method to its target area of prey.

Here Xi,jP1 is the ith pelican’s new position in the jth gene, according to phase 1 analysis, Pj is the position of prey in the jth dimension, and Ep is its OF value computed depending on the entropy of the gene. I is a random number equal either 1 or 2. When this parameter’s value is 2, it causes a member to experience more dislocation, which may result in that member’s selection of a fresher gene in the dataset. It significantly affects how precisely the EPOA may examine the gene search space. If the value of the entropy is increased at the novel gene position for a pelican, the suggested EPOA will approve it. This sort of updating, sometimes referred to as effective updating, prevents the model from moving to less-than-ideal areas. Equation (8) is used to simulate this procedure.

Where XiP1 is the novel position of the ith pelican and FiP1 is its fitness function value depending on phase 1.
Phase 2: Winging on the Water Surface (Exploitation Phase)
The fish are propelled forward by the pelicans’ expanded wings as they approach the water’s surface for the second phase before being captured in their throat pouches. This procedure improves POA’s capacity for exploitation and local gene search. For gene solution, it checks the points nearby the pelican position. Equation (9) employs the mathematical computation to imitate the pelican’s chasing behavior.
![]()
Where Xi,jP2 is the novel gene solution of the ith pelican in the jth gene depending on phase 2, R is a constant, which is equal to 0,2, R·(1 − t/T) is the neighbourhood radius of Xi,j while, T is the maximum amount of iterations and t is the iteration counter. The coefficient “R· (1 − t/T)” is used to search locally for the closest gene in order to arrive at an improved DCM solution. It displays the population’s neighbours’ neighbourhood’s radius. It works well with EPOA exploitation to come even closer to the greatest possible gene solution. Because of the high value of this coefficient in the initial iterations, a larger area surrounds every member is taken into account. The “R· (1 − t/T)” coefficient lowers as the method replicates more, resulted in decreasing radii of each member’s neighbourhood. Given the dataset, EPOA can converge to conclusions that are nearer to the overall optimal gene. Equation (10) has been applied to reject or accept the revised pelican position.

Where XiP2 is the novel status of the ith pelican and FiP2 is its objective function value. Every population member and the OF’s values will be updated after which the ideal candidate solution will be modified. The system moved to the following iteration, repeating the stages of the suggested EPOA using equations (2) through (10) until the full execution is complete. The pseudo-code of EPOA is represented in Algorithm 1.
Algorithm 1. Pseudo-code of EPOA
Start EPOA
Enter the dataset for the gene selection task.
Calculate the iterations number (T) and EPOA population (N) size.
Determine the fitness function using equations (4-6) and the original position of the pelicans.
For t = 1: T
Create the prey’s gene position at arbitrary.
For I = 1: N
Phase 1: approaching prey (exploration phase)
For j = 1: m
Use equation (7) to determine the jth gene’s new position.
End
Equation (8) is used to update the ith population member.
Phase 2: Winging on the water surface (exploitation phase)
For j = 1: m
Utilizing equation (9) evaluate the jth gene’s newest position.
End
Equation (10) should be updated for the ith population member.
End
Update the recommended result
End
Optimal gene output discovered by EPOA
End EPOA
Deep autoencoder (dae) classification
The reliable unsupervised learning model for the classification of HF with DCM is the autoencoder that utilizes a deep neural network. This method is extensively suited for classification since it may be used to extrapolate informative and differentiating characteristics from a large unlabelled dataset.(24,25) An autoencoder essentially consists of hidden, three-layer NN with IL (Input Layer), and OL (Output Layers) for the encoder and Hidden Layer HL and OL for the decoder. The encoder converts a feature vector with a lower dimension from an input gene dataset with a higher dimension. The decoder then transforms the dataset into the input dimension. Thus, assist with the autoencoder correctly recreate the decoder’s output, it is used to establish a complex nonlinear connection among the input datasets. Because of this, significant characteristics will be preserved in the concealed layer and the reconstruction error will continuously reduce over the training time. The result of the hidden layer will also demonstrate the success of the autoencoder’s categorization. The basic DAE arrangement is presented in figure 2.(26)

Figure 2. Deep autoencoder (dae) framework
Gene data instances for the n-dimension input X=[x1,x2,…,xn], Equation (11) can be used to represent the output/activation of the hidden layer h with m-dimension (m< n).(27)
![]()
Where, b(1), fh and W(1)x indicate the bias, activation, and weight matrixes connecting the input and hidden layers, accordingly. Following the decoding procedure, the output layer’s reconstruction of the data, x can be stated as follows.(27)
![]()
Here, b(2), W(2) indicate the output layer’s bias vector and weight matrix. Typically, a sigmoid function is employed as the AF (Activation Function) for the decoder and encoder elements. f(t)=1/((1+e^(-t))) or given data type, any different activation function may be used. Initial weight and bias values are used in the training process. The settings must be changed during training in order to minimize the reconstruction error among the input data and reconstructed output. The mean squared error (MSE), which is indicated in equation (13) and used in evaluation, is used to quantify the reconstruction error.(27)

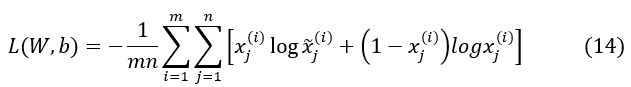
Further instances, BCEL (Binary Cross-Entropy Loss) may be estimated as the reconstruction error utilizing equation (14) if the input values are between 0 and 1.(27)
In this investigation, the activation function for the DAE’s output and hidden layers is Scaled Exponential Linear Unit (SELU). In addition to being an ideal option for the DCM classification and addressing the vanishing gradient issue in the DAE design, SELU is a non-saturating form of AF. By combining the DAE, SELU has been utilized to speed up the training process. Equation (15) can be used to describe SELU.(27)
![]()
Thus, the values for the coefficients λ and α are fixed to around 1,05 and 1,6731, accordingly. Adaptive moment estimation (Adam), which is utilized in this study, is the optimizer for updating the weight. Due to its capacity to learn previous gradients and also previous squared gradients significantly declining loss function average, this optimizer technique is quickly gaining popularity. In this analysis, a DAE is applied to classify DCM samples and the architecture is provided in table 2.
|
Table 2. Structure of the designed deep autoencoder (dae) |
|||
|
Layer # |
Layer Type |
Number of nodes |
Activation |
|
1 |
Input (Encoder) |
2560 |
- |
|
2 |
Hidden (Encoder) |
1280 |
SELU |
|
3 |
Hidden (Encoder) |
640 |
SELU |
|
4 |
Hidden (Encoder) |
320 |
SELU |
|
5 |
Hidden (Encoder) |
128 |
SELU |
|
6 |
Hidden (Encoder/ Decoder) |
32 |
SELU |
|
7 |
Hidden (Decoder) |
128 |
SELU |
|
8 |
Hidden (Decoder) |
320 |
SELU |
|
9 |
Hidden (Decoder) |
640 |
SELU |
|
10 |
Hidden (Decoder) |
1280 |
SELU |
|
11 |
Output (Decoder) |
2560 |
SELU |
RESULTS AND DISCUSSION
This part displays the outcomes of the classifier study of the NCBI GEO dataset. From the NCBI GEO the database, five distinct datasets on heart rhythm were obtained.(23) From the European Nucleotide Archive website (https://www.ebi.ac.uk/ena), raw data (FASTQ files) were obtained. Then, various techniques have been suggested for results comparison. Using classification and feature selection provides the numerous performance indices that are currently in usage. In the dataset, 70 % of samples are used training, and 30 % of samples has been employed for testing.
Performance measures: recall, precision, F-measure, accuracy, and error have been used to evaluate the classifiers in this study. The outline of the confusion matrix is revealed in table 3.
|
Table 3. Confusion matrix in this study |
||
|
Actual Class |
Prediction Class |
|
|
P |
N |
|
|
P |
TP |
FN |
|
N |
FP |
TN |
The performance of classifiers was assessed using the following metrics: accuracy, f-measure, recall, specificity, sensitivity, and precision. With the direction of the following equations (16–20).

True Positive (TP) signifies that the positive samples’ diagnoses were accurate. False Negative (FN) denotes an inaccurate diagnosis of the positive samples. False Positive (FP) denotes erroneous diagnosis of the non-positive samples. True Negative (TN) signifies that the non-positive samples diagnoses were accurate.
|
Table 4. Gene selection results |
||
|
GSE116250 |
GSE57344 |
GSE71613 |
|
ENSG00000000005 TNMD |
MIR1247 |
ENSG00000000003 |
|
ENSG00000000003 TSPAN6 |
MIR125B1 |
ENSG00000000938 |
|
ENSG00000000457SCYL3 |
MFSD11 |
ENSG00000001084 |
|
ENSG00000000938FGR |
METTL2A |
ENSG00000001461 |
|
ENSG00000001167NFYA |
ABCA10 |
ENSG00000001561 |
|
ENSG00000001460STPG1 |
ACAD10 |
ENSG00000002933 |
Some of the selected genes results of proposed system are discussed in table 4. Accuracy results comparison of classifiers before and after feature selection is discussed in table 5.
|
Table 5. Accuracy comparison of classifiers (before and after fs algorithm) |
|||
|
DATASET |
Classifiers |
Feature Selection Accuracy (%) |
|
|
Before |
After |
||
|
GSE116250 |
GNN+SVM |
75,15 |
84,47 |
|
GADNN |
78,58 |
86,93 |
|
|
BADNN |
80,47 |
88,49 |
|
|
EPOA+DAE |
85,18 |
91,06 |
|
|
GSE57344 |
GNN+SVM |
77,17 |
86,42 |
|
GADNN |
80,38 |
88,32 |
|
|
BADNN |
82,66 |
91,55 |
|
|
EPOA+DAE |
84,49 |
93,44 |
|
|
GSE71613 |
GNN+SVM |
71,88 |
80,18 |
|
GADNN |
73,49 |
83,65 |
|
|
BADNN |
76,77 |
86,48 |
|
|
EPOA+DAE |
81,19 |
89,72 |
|
|
Table 6. Comparative performance of the suggested classifiers with existing methods |
||||||
|
DATASET |
Classifiers |
Precision (%) |
Recall (%) |
F - Measure (%) |
Accuracy (%) |
Error (%) |
|
GSE116250 |
GNN+SVM |
82,66 |
80,04 |
81,35 |
84,47 |
15,53 |
|
GADNN |
84,95 |
82,19 |
83,57 |
86,93 |
13,07 |
|
|
BADNN |
86,44 |
84,82 |
85,63 |
88,49 |
11,51 |
|
|
EPOA+DAE |
90,21 |
86,29 |
88,25 |
91,06 |
8,94 |
|
|
GSE57344 |
GNN+SVM |
80,19 |
82,27 |
81,23 |
86,42 |
13,58 |
|
GADNN |
82,26 |
84,46 |
83,36 |
88,32 |
11,68 |
|
|
BADNN |
84,39 |
86,59 |
85,49 |
91,55 |
8,45 |
|
|
EPOA+DAE |
86,61 |
88,29 |
87,45 |
93,44 |
6,56 |
|
|
GSE71613 |
GNN+SVM |
78,18 |
80,74 |
79,46 |
80,18 |
19,82 |
|
GADNN |
81,11 |
83,33 |
82,22 |
83,65 |
16,35 |
|
|
BADNN |
83,45 |
85,87 |
84,66 |
86,48 |
13,52 |
|
|
EPOA+DAE |
85,72 |
86,64 |
86,18 |
89,72 |
10,28 |
|

Figure 3. Precision comparison vs. Classifiers
Figure 3 presents the precision comparison of classifiers like GNN+SVM, GADNN, BADNN, and proposed classifier (EPOA+DAE) with respect to gene datasets (GSE116250, GSE57344, and GSE71613). EPOA+DAE classifier has produces highest precision results of 90,21 %, 86,61 %, and 85,72 % (GSE116250, GSE57344, and GSE71613). GNN+SVM, GADNN, BADNN has lowest precision of 82,66 %, 84,95 %, and 86,44 % for GSE116250 dataset (Refer Table 6).

Figure 4. Recall comparison vs. Classifiers

Figure 5. F-measure comparison vs. Classifiers
Recall comparison of classifiers like GNN+SVM, GADNN, BADNN, and proposed classifier (EPOA+DAE) with respect to gene datasets (GSE116250, GSE57344, and GSE71613) has been illustrated in figure 4. EPOA+DAE classifier has produces highest recall results of 86,29 %, 88,29 %, and 86,64 % (GSE116250, GSE57344, and GSE71613). GNN+SVM, GADNN, BADNN has lowest recall of 80,04 %, 82,19 %, and 84,82 % for GSE116250 dataset (Refer Table 6).
F-measure comparison of classifiers like GNN+SVM, GADNN, BADNN, and proposed classifier (EPOA+DAE) by gene datasets (GSE116250, GSE57344, and GSE71613) are illustrated in figure 5. EPOA+DAE classifier has produced highest F-measure results of 88,25 %, 87,45 %, and 86,18 % (GSE116250, GSE57344, and GSE71613). GNN+SVM, GADNN, BADNN has lowest F-measure of 81,35 %, 83,57 %, and 85,63 % for GSE116250 dataset (Refer Table 6).

Figure 6. Accuracy comparison vs. Classifiers
Accuracy comparison of classifiers like GNN+SVM, GADNN, BADNN, and proposed classifier (EPOA+DAE) by gene datasets (GSE116250, GSE57344, and GSE71613) has been illustrated in figure 6. EPOA+DAE classifier has produces highest accuracy results of 91,06 %, 93,44 %, and 89,72 % (GSE116250, GSE57344, and GSE71613). GNN+SVM, GADNN, BADNN has lowest accuracy of 84,47 %, 86,93 %, and 88,49 % for GSE116250 dataset (Refer Table 6).
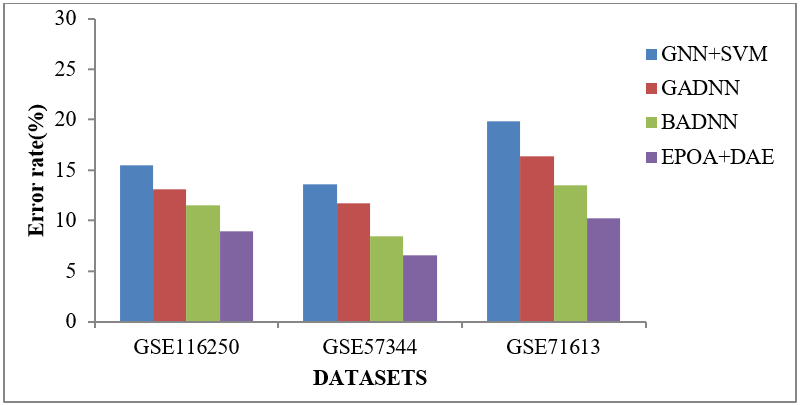
Figure 7. Error rate comparison vs. Classifiers
Error rate comparison of classifiers like GNN+SVM, GADNN, BADNN, and proposed classifier (EPOA+DAE) of gene datasets (GSE116250, GSE57344, and GSE71613) are illustrated in figure 7. EPOA+DAE classifier has produces lowest error rate results of 8,94 %, 6,56 %, and 10,28 % (GSE116250, GSE57344, and GSE71613). GNN+SVM, GADNN, BADNN has highest error rate of 15,53 %, 13,07 %, and 11,51 % for GSE116250 dataset (Refer Table 6).
CONCLUSION AND FUTURE WORK
This study, EPOA, a novel stochastic nature-inspired optimization approach is introduced for feature selection. EPOA is a simulation of pelicans’ normal hunting activity. In POA, pelicans serve as search agents by seeking food sources. In the EPOA, fitness is computed depending on the entropy range of the feature in the gene dataset. To identify the primary optimum region of the search space, POA exploration is employed. Then Deep Autoencoder (DAE) classifier is used to classify the samples into normal / DCM for approximating the behaviour of the data. While the EPOA approach eliminated noisy genes, the outcomes were found to be excellent. With three datasets, the suggested technique was seen to pick the fewest number of genes during the wrapper process. Additionally, the empirical analysis findings showed that EPOA+DAE functioned better than other suggested algorithms, with a prediction accuracy of 91,06 %, 93,44 %, and 89,72 % (GSE116250, GSE57344, and GSE71613). The utility, adaptability, and applicability of feature selection in the DAE domain have been successfully proved in this research. Future clinical use of DCM-related genes is used as targets for medicine and diagnostic indicators.
REFERENCES
1. Bozkurt B, Colvin M, Cook J, Cooper LT, Deswal A, Fonarow GC, Francis GS, Lenihan D, Lewis EF, McNamara DM, and Pahl E. Current diagnostic and treatment strategies for specific dilated cardiomyopathies: a scientific statement from the American Heart Association. Circulation, 134(23), pp. e579-e646. https://doi.org/10.1161/CIR.0000000000000455.
2. Pinto YM, Elliott PM, Arbustini E, Adler Y, Anastasakis A, Böhm M, Duboc D, Gimeno J, de Groote P, Imazio M, and Heymans S. Proposal for a revised definition of dilated cardiomyopathy, hypokinetic non-dilated cardiomyopathy, and its implications for clinical practice: a position statement of the ESC working group on myocardial and pericardial diseases. European heart journal, 37(23), pp. 1850-1858. https://doi.org/10.1093/eurheartj/ehv727.
3. Merlo M, Cannatà A, Pio Loco C, Stolfo D, Barbati G, Artico J, Gentile P, De Paris V, Ramani F, Zecchin M, and Gigli M. Contemporary survival trends and aetiological characterization in non‐ischaemic dilated cardiomyopathy. European Journal of Heart Failure, 22(7), pp. 1111-1121. https://doi.org/10.1002/ejhf.1914.
4. Miladinović A, Ajčević M, Jarmolowska J, Marusic U, Colussi M, Silveri G, Battaglini PP, and Accardo A. Effect of power feature covariance shift on BCI spatial-filtering techniques: A comparative study. Computer Methods and Programs in Biomedicine, 198, pp. 105808. https://doi.org/10.1016/j.cmpb.2020.105808.
5. Obermeyer Z, and Emanuel EJ. Predicting the future—big data, machine learning, and clinical medicine. The New England journal of medicine, 375(13), pp. 1216–1219. https://doi.org/10.1056%2FNEJMp1606181.
6. Elshawi R, Al-Mallah MH, and Sakr S. On the interpretability of machine learning-based model for predicting hypertension. BMC medical informatics and decision making, 19, pp. 1-32. https://doi.org/10.1186/s12911-019-0874-0.
7. Krittanawong C, Zhang H, Wang Z, Aydar M, and Kitai T. Artificial intelligence in precision cardiovascular medicine. Journal of the American College of Cardiology, 69(21), pp. 2657-2664. https://doi.org/10.1016/j.jacc.2017.03.571.
8. Li Y, Mansmann U, Du S, and Hornung R. Benchmark study of feature selection strategies for multi-omics data. BMC bioinformatics, 23(1), pp. 1-18. https://doi.org/10.1186/s12859-022-04962-x.
9. Yan C, Li M, Ma J, Liao Y, Luo H, Wang J, and Luo J. A novel feature selection method based on MRMR and enhanced flower pollination algorithm for high dimensional biomedical data. Current Bioinformatics, 17(2), pp. 133-149. https://doi.org/10.2174/1574893616666210624130124.
10. Rahkar Farshi T. Battle royale optimization algorithm. Neural Computing and Applications, 33(4), pp. 1139-1157. https://doi.org/10.1007/s00521-020-05004-4.
11. Schiano C, Franzese M, Geraci F, Zanfardino M, Maiello C, Palmieri V, Soricelli A, Grimaldi V, Coscioni E, Salvatore M, and Napoli C. Machine learning and bioinformatics framework integration to potential familial DCM-related markers discovery. Genes, 12(12), pp.1-14. https://doi.org/10.3390/genes12121946.
12. Zhu T, Wang M, Quan J, Du Z, Li Q, Xie Y, Lin M, Xu C, and Xie Y. Identification and verification of feature biomarkers associated with immune cells in dilated cardiomyopathy by bioinformatics analysis. Frontiers in Genetics, 13, pp. 1-13. https://doi.org/10.3389/fgene.2022.874544.
13. Chen K, Shi Y, and Zhu H. Analysis of the role of glucose metabolism-related genes in dilated cardiomyopathy based on bioinformatics. Journal of Thoracic Disease, 15(7), pp. 3870-3884. https://doi.org/10.21037%2Fjtd-23-906.
14. Xie W, Li W, Zhang S, Wang L, Yang J, and Zhao D. A novel biomarker selection method combining graph neural network and gene relationships applied to microarray data. BMC bioinformatics, 23(1), pp. 1-18. https://doi.org/10.1186/s12859-022-04848-y.
15. Kang Y, Wang H, Pu B, Tao L, Chen J, and Philip SY. A hybrid two-stage teaching-learning-based optimization algorithm for feature selection in bioinformatics. IEEE/ACM transactions on computational biology and bioinformatics, pp. 1746-1760. https://doi.org/10.1109/TCBB.2022.3215129.
16. Yang, Y., Liu, P., Teng, R., Liu, F., Zhang, C., Lu, X. and Ding, Y., 2022. Integrative bioinformatics analysis of potential therapeutic targets and immune infiltration characteristics in dilated cardiomyopathy. Annals of Translational Medicine, 10(6), pp. 1-16. https://doi.org/10.21037%2Fatm-22-732.
17. Jiang C, and Zhong G. Identify the characteristic genes of dilated cardiomyopathy and immune cell infiltration based on bioinformatics and machine learning. Xi bao yu fen zi Mian yi xue za zhi= Chinese Journal of Cellular and Molecular Immunology, 39(1), pp. 26-33.
18. Dauda KA, Olorede KO, and Aderoju SA. A novel hybrid dimension reduction technique for efficient selection of bio-marker genes and prediction of heart failure status of patients. Scientific African, 12, pp. e00778. https://doi.org/10.1016/j.sciaf.2021.e00778.
19. Chen YX, Ding J, Zhou WE, Zhang X, Sun XT, Wang XY, Zhang C, Li N, Shao GF, Hu SJ, and Yang J. Identification and functional prediction of long non-coding RNAs in dilated cardiomyopathy by bioinformatics analysis. Frontiers in Genetics, 12, pp. 1-12. https://doi.org/10.3389/fgene.2021.648111.
20. Song W, Lu F, Ding Z, Huang L, Hu K, Chen J, and Wei L. Identification of heparan sulfate in dilated cardiomyopathy by integrated bioinformatics analysis. Frontiers in Cardiovascular Medicine, 9, pp. 1-10. https://doi.org/10.3389/fcvm.2022.900428.
21. Zhang M, Wang X, Chen W, Liu W, Xin J, Yang D, Zhang Z, and Zheng X. Integrated bioinformatics analysis for identifying key genes and pathways in female and male patients with dilated cardiomyopathy. Scientific Reports, 13(1), pp. 1-12. https://doi.org/10.1038/s41598-023-36117-0.
22. Rau A, Marot G, and Jaffrézic F. Differential meta-analysis of RNA-seq data from multiple studies. BMC bioinformatics, 15, pp.1-10. https://doi.org/10.1186/1471-2105-15-91.
23. Trojovský P, and Dehghani M. Pelican optimization algorithm: A novel nature-inspired algorithm for engineering applications. Sensors, 22(3), pp.1-34. https://doi.org/10.3390/s22030855.
24. Li H, Meng L, Zhang J, Tan Y, Ren Y, and Zhang H. Multiple description coding based on convolutional auto-encoder. Ieee Access, 7, pp. 26013-26021. https://doi.org/10.1109/ACCESS.2019.2900498.
25. Pan Y, He F, and Yu H. Learning social representations with deep autoencoder for recommender system. World Wide Web, 23(4), pp. 2259-2279. https://doi.org/10.1007/s11280-020-00793-z.
26. Yu J, Zheng X, and Wang S. A deep autoencoder feature learning method for process pattern recognition. Journal of Process Control, 79, pp. 1-15. https://doi.org/10.1016/j.jprocont.2019.05.002.
27. Toma RN, Piltan F, and Kim JM. A deep autoencoder-based convolution neural network framework for bearing fault classification in induction motors. Sensors, 21(24), pp. 1-21. https://doi.org/10.3390/s21248453.
FINANCING
“The authors did not receive financing for the development of this research”.
CONFLICT OF INTEREST
“The authors declare that there is no conflict of interest”.
AUTHORSHIP CONTRIBUTION
Conceptualization: T. Sangeetha.
Data curation: K. Manikandan.
Formal analysis: D. Victor Arokia Doss.
Research: T. Sangeetha.
Methodology: D. Victor Arokia Doss.
Drafting - original draft: K. Manikandan.
Writing - proofreading and editing: T. Sangeetha.