Category: STEM (Science, Technology, Engineering and Mathematics)
ORIGINAL
A Comparative Study on Dip Coating and Corrosion Behavior of Ti-13Zr-13Nb and Commercially Pure Titanium Alloys Coated with YSZ by Taguchi Design
Estudio comparativo sobre el recubrimiento por inmersión y el comportamiento de corrosión de Ti-13Zr-13Nb y aleaciones de titanio comercialmente puro recubiertas con YSZ por Taguchi Design
Marwan B. Hussein1 *, Ali M. Mustafa1 *, Makarim H. Abdulkareem1 *
1Production Eng. and metallurgy. Dept, University of Technology. Baghdad, Iraq.
Cite as: Hussein MB, Mustafa AM, Abdulkareem MH. A Comparative Study on Dip Coating and Corrosion Behavior of Ti-13Zr-13Nb and Commercially Pure Titanium Alloys Coated with YSZ by Taguchi Design. Salud, Ciencia y Tecnología - Serie de Conferencias. 2024; 3:847. https://doi.org/10.56294/sctconf2024847
Submitted: 28-01-2024 Revised: 14-04-2024 Accepted: 04-06-2024 Published: 05-06-2024
Editor:
Dr.
William Castillo-González ![]()
Note: paper presented at the 3rd Annual International Conference on Information & Sciences (AICIS’23).
ABSTRACT
This work evaluates experimentally the corrosion and tip testing of Ti-13Zr-13Nb joint implant alloys and commercially pure titanium (cp-Ti) covered with YSZ nanoceramic. Through the use of the Taguchi design of experiments (DOE) approach, the dip coating process produced a thin sticky covering. The effects of temperature, YSZ concentration, duration, and the level of Ti alloy substrate grinding during dip coating were investigated using a L9-type orthogonal Taguchi array to determine the deposition yield. The thickness and adhesion tests that were utilized to optimize the dip coating conditions served as the input data, and the Ti alloys were coated using the ideal dip coating technique parameters as previously mentioned. For commercial Ti, the ideal values for YSZ coating thickness and adhesion were 60°C, 10 seconds, 10 % concentration, and 250 degrees of grinding; correspondingly, for Ti-13Zr-13Nb, the ideal values were 60°C, 10 seconds, 15 % concentration, and 400 degrees of grinding. For both Cp-Ti and Ti-13Zr-13Nb, the obtained thickness and removal area (adhesion) were 58,5 µm and 11,45 %, respectively, and 69,5µm and 9,33 %, respectively. High-resolution scanning electron microscopy (FE-SEM) images were used to study the coated alloys; optical microscopy and AFM were used to identify the microstructure and thickness measurements of the coated surfaces; EDAX was used to analyze the coating composition; and XRD was used to analyze the formed phases. The optimized coated Ti alloys’ corrosion resistance was investigated in simulated body fluid (SBF) using electrochemical methods such as cyclic polarization and Tafel polarization, and the adhesion strength of the coatings was measured using a tip tester. The following corrosion-resistant values were used to compare Ti-13Zr-13Nb and coated Cp-Ti: In Ringer’s solution at 37°C, both coating alloys—Cp-Ti and Ti-13Zr-13Nb—improved corrosion resistance; however, the coated Ti-13Zr-13Nb alloy demonstrated greater corrosion resistance than the coated Cp-Ti alloy (5,417×10-3 and 1,042×10-2, respectively).
Keywords: Dip Coating; Taguchi; Titanium Alloys; YSZ; Corrosion.
RESUMEN
Este trabajo evalúa experimentalmente la corrosión y los ensayos de punta de aleaciones de implantes de articulaciones Ti-13Zr-13Nb y titanio comercialmente puro (cp-Ti) recubiertas con nanocerámica YSZ.
Mediante el uso del enfoque de diseño de experimentos (DOE) de Taguchi, el proceso de recubrimiento por inmersión produjo un recubrimiento delgado y pegajoso. Los efectos de la temperatura, la concentración de YSZ, la duración y el nivel de esmerilado del sustrato de aleación de Ti durante el recubrimiento por inmersión se investigaron utilizando un array Taguchi ortogonal de tipo L9 para determinar el rendimiento de la deposición. Las pruebas de espesor y adherencia que se utilizaron para optimizar las condiciones de recubrimiento por inmersión sirvieron como datos de entrada, y las aleaciones de Ti se recubrieron utilizando los parámetros ideales de la técnica de recubrimiento por inmersión como se ha mencionado anteriormente. Para el Ti comercial, los valores ideales de espesor y adherencia del recubrimiento con YSZ fueron 60°C, 10 segundos, 10 % de concentración y 250 grados de esmerilado; correspondientemente, para el Ti-13Zr-13Nb, los valores ideales fueron 60°C, 10 segundos, 15 % de concentración y 400 grados de esmerilado. Tanto para el Cp-Ti como para el Ti-13Zr-13Nb, el espesor y el área de eliminación (adhesión) obtenidos fueron de 58,5µm y 11,45 %, respectivamente, y de 69,5µm y 9,33 %, respectivamente. Se utilizaron imágenes de microscopía electrónica de barrido de alta resolución (FE-SEM) para estudiar las aleaciones recubiertas; microscopía óptica y AFM para identificar la microestructura y mediciones de espesor de las superficies recubiertas; EDAX para analizar la composición del recubrimiento; y XRD para analizar las fases formadas. Se investigó la resistencia a la corrosión de las aleaciones de Ti recubiertas optimizadas en fluido corporal simulado (SBF) utilizando métodos electroquímicos como la polarización cíclica y la polarización de Tafel, y se midió la fuerza de adhesión de los recubrimientos utilizando un probador de puntas. Se utilizaron los siguientes valores de resistencia a la corrosión para comparar el Ti-13Zr-13Nb y el Cp-Ti recubierto: En solución de Ringer a 37°C, ambas aleaciones de recubrimiento-Cp-Ti y Ti-13Zr-13Nb-mejoraron la resistencia a la corrosión; sin embargo, la aleación Ti-13Zr-13Nb recubierta demostró una mayor resistencia a la corrosión que la aleación Cp-Ti recubierta (5,417×10-3 y 1,042×10-2, respectivamente).
Palabras clave: Recubrimiento por Inmersión; Taguchi; Aleaciones de Titanio; YSZ; Corrosión.
INTRODUCTION
Titanium alloys are often utilized in the medical industry, particularly in total joint replacement, due to their advantageous properties such as low density, low toxicity, biological compatibility, high specified strength, and outstanding corrosion resistance.(1,2) Bioceramic coatings are often used in biomedical applications to alter the surface of implant materials and create new surfaces that possess unique characteristics separate from the underlying material. Dip coating is an alternative method used to provide a protective layer to orthopedic prosthetic devices. The sol-gel method has many advantages compared to other coating processes, such as the ability to manipulate and regulate coating morphology, chemistry, and structure.(3,4) In addition, by selecting appropriate additives, it is feasible to decrease the sintering temperature.(5) Milella et al.(6) applied a bio-ceramic composite onto a titanium substrate by using the dip-coating process. Several surface modification approaches are now under investigation to improve the functioning of medical implants. Some examples of surface modification techniques include laser modification,(7) thermal oxidation,(8) sand blasting,(9) sol-gel formation coating,(10) physical vapor deposition (PVD) processes,(11) chemical vapor deposition (CVD) procedures,(12) plasma spray,(13) and processes that result in the formation of titanium dioxide constructions on titanium surfaces.(14) Two surface alterations led to the creation of titanium dioxide nanotubes by anodizing(15) and titanium oxide nanofibers through electrospinning.(16,17) According to Hamlekhan et al., the presence of nanoscale features and surface modification on implant surfaces may promote the growth of osteoblast cells responsible for bone production. This may be attributed to the resemblance between the nanoscale properties and the biological surroundings of osteoblasts.(18) Partially-yttria stabilization zirconia (YSZ) is a commonly used material for thermal barrier coatings (TBCs) due to its favorable mechanical and thermal properties. These include low temperature conductivity, a relatively large temperature expansion coefficient, lower Young's modulus, and high hardness and durability.(19,20) A heuristic approach is used, which is a time-consuming, costly, and inefficient technique. mplementing statistical approaches, such as the Taguchi Designs of Experimental (DOE) methodology,(21,22) may greatly enhance the process of optimization by reducing the number of trials required. This approach is a sophisticated Design of Experiments (DOE) procedure that may be used to simulate and evaluate the impact of control variables on performance outcomes.(23,24) The novelty of this work was the application of a YSZ coating onto Cp-Ti and Ti-13Zr-13Nb alloys utilizing the dip coating method. The objective and extent of this study are to determine the optimal coating for the two titanium alloys by assessing the corrosion rate.
METHOD
Materials
Ti-13Zr-13Nb and commercial pure Ti grade 2 bars were supplied by Baoji Jinsheng Metal Material Co., Ltd. And were cut to 10 mm in diameter with 2mm thickness. They were ground with different grits (250, 280, and 400) with SiC papers. The samples were degreased with acetone and washed with deionized (DI) water. Zirconia-Yttria (ZrO2 + 3 mol% Y2O3, 20–50 nm, purity of 99,5 %, spherical white color, bulk density 0,6–1 g/cm2) purchased from Nano Amor was used to prepare functionally graded material coatings. PVP (medium molecular weight with a degree of deacetylation of about 85 % soluble in 1 % acetic acid) and P2O5 were purchased from Sigma Aldrich.
Suspensions preparation
Procedure: there are three mixtures prepared with varied concentrations of YSZ particles to determine the optimal adhesion and coating thickness (10, 15, and 20 % wt%). In the first step, 0,50 in 50 ml YSZ and 0,1 g of polyvinyl poly PVP and 0,5 gm P2O5 were dissolved in a solution of 5 % water, 1 % acetic acid, along with 94 % ethanol. The YSZ nanopowder has been added to the 50 ml suspension backer, and all suspensions had been deagglomerated for 24 hours using a magnetic stir. It was then followed by a 30-minute treatment with a highly energetic sonicator (ultrasonic processor speed, MIXSONIX Established, New York, USA). Before the coating procedure, the range of the PH level (4–4,5) of the mixture were adjusted using a (pH tester 818) with acetic acid.
Dip Coating
There are three solutions prepared with varied concentrations of YSZ nanopowder to determine the optimal adhesion and coating thickness (10, 15, and 20 % wt%). The mixtures were heated to the various temperatures (30, 45, and 60 °C) using a hot rod with a magnetic agitator and vigorous mixing, (250, 280, 400) degree of grinding. The sample was carefully immersed in the mixtures for five, ten, and fifteen seconds before being removed and left to dry. The process was repeated to create another layer, which was then left to air-dry.
Taguchi experimental design
In these investigations, the concentration of YSZ, the applied temperature, the grid of samples, and the deposition time were chosen as the control variables. Table 1 outlines the significance levels of each factor. By employing these three control variables, an orthogonal Taguchi arrangement of L9 type (L stands for Latin square and 9 indicates the number of repetitions of the investigations) was constructed. Table 2 displays the design specifications for the L9 orthogonal array. Utilized were four levels of parameters (YSZ concentration, milling degree, temperature, and duration). Each run was replicated at least three different times, with the average value and standard deviation being recorded. The analyses were conducted using the statistical software MINITAB 15. Notably, the employed method eliminates 160 Dipping coating cycles for complete factorial design, which provides significant time and cost savings.
Characterization
Adhesion test by tip test analysis
According to the literature review, there are over 250 methods for determining the degree of adhesion of coatings upon substrates. The pull-off test, the tape tear test, the nano-indentation test, and the abrasion test are frequently used to evaluate adhesion strength. Coating and substrate properties influence test methods, and a suitable testing method will likely simulate the utilization stress. The pull-off test technique should be applicable to coatings with a thickness greater than 20 µm and the disadvantages of epoxy adhesive penetration within the coating and irregular flaking of the coating. The tape peel-off testing also has limitations, including a lack of reproducibility, and it is not quantitative.(25) The tip test is a dependable, reproducible, and quantifiable adhesion testing equipment that does not require the penetration of epoxy adhesive into the coating system. For YSZ coatings, a qualitative abrasion test was performed. Imagen software was used to analyze the data on the computer. The investigation was conducted by applying a force of 1 N to the strength of adhesion via a 5 mm stroke width and a scratch speed equal to 0,5 mm/s on the ramp. Using crosshatch tape, the adhesion intensity between the coats and the base material was determined in accordance with ASTM standard D3359. Five lengthy cuts were carried out on the specimens in each direction (at least 4 mm separated each cut from the next), after which the test was conducted through applying and then removing the tape in the coating's surface at the grit intersection.
The analysis of optical microscopy images and FE-SEM-EDAX
Using an optical microscope equipped with a digital camera, the amount of thickness of an YSZ coating on the Ti-13Zr-13Nb along with commercially available titanium alloys was analyzed. The mean thickness of the optimum coating was calculated by taking at least three measurements at various locations on the coated sample. Using a scanning electron microscope outfitted with elemental analysis equipment (FE-SEM-EDAX, FEI, Axia Chami-SEM), the microstructure, morphological features, and elemental composition of the manufactured YSZ coating were analyzed. The water angle of contact was determined utilizing the sessile dropping method and an automatic dropped shape analysis (SL200B, United States). For each composite coating, duplicate specimens were evaluated.
XRD analysis
Using an X-ray diffraction device (XRD-6000, Shimadzu) with a scanning rate of 3° min1 and a step width of 0,05° in the 2° interval ranging from 10° to 90°, phase analysis was performed.
Atomic force microscopy
The surface texture and thickness on the coated interface were evaluated using a micrometer and AFM 3-D interface imaging in tapping mode (MOUNTAINS9). The probe consisted of a thin silicon tip attached to a nitride lever. The surface area analyzed measured 40 µm x 40 µm.
Contact angle
Using a contact angle measurement instrument (Creating Nanotechnology Tech., Model: CAM110P, Serial No. 113031201804W) and a CCD camera, wettability testing was conducted. In this test technique, the hydrophobicity or as wettability of the coated substrate can be evaluated and measured utilizing the static drop of deionized water by measuring both liquid and solid contact angles. The specimens and contact angle values have been determined and then averaged.
Corrosion test
To assess the in-vitro corrosion resistance of electrophoretically deposited YSZ coatings. Open circuit potential (OCP): measurements of time, two categories of corrosion testing exist. The first technique used to evaluate the corrosion parameters in the samples is Tafel extrapolation. Indicating the probability of pitted corrosion Epp along with the probability of pitted corrosion current density Ipp is reversion anodic polarization. The resistance to corrosion of 10-by-2-millimeter sample groups was evaluated. The uncoated pieces were ground and polished, whereas those with coatings were not, before being examined in SBF solution. The opposite electrode consisted of a platinum filament, while the standard electrode was Ag/AgCl. For in-vitro protection against corrosion experiments for assessing the in-vitro corroded protection efficacy of the coatings, a revised simulation of body fluid (r-SBF) was employed. SBF (pH 7,4) contained the following elements: Na+ 142,0 mM, K+ 5,0 mM, Mg2+ 1,5 mM, Ca2+ 2,5 mM, HCO3- 4,2 mM, Cl- 147,8mM, HPO42- 1,0mM, and SO 42+ 0,5mM. -1000 mV to +1500 mV was selected as the potential range under investigation. Using a potentiostat of this type (WENKING M, LAB), a complementary test was conducted. The Electrochemical System was manufactured in Germany. Using potentiostat software, the corrosion current intensity (icorr) and potential for corrosion (Ecorr) were measured by analyzing data values (current-voltage).
RESULTS AND DISCUSSION
Selection of optimum conditions
In order to select the optimal conditions (temperature, time, Concentration and degree of grinding) to deposit coating layers of YSZ for two Titanium alloys, the Taguchi approach was used (table 1). There are two types of output data required in this study: thickness and roughness. Parameters used in dip coating are shown in table 2.
|
Table 1. Parameters used in dip coating |
|||
|
Temperatura |
60 |
45 |
30 |
|
Time, sec. |
15 |
10 |
5 |
|
Concentrations % |
20 |
15 |
10 |
|
Degree of grinding |
400 |
280 |
250 |
Taguchi Results
The optimal conditions to YSZ layer preparing on commercially available Ti and Ti-13Zr-13Nb substrates were determined using the Taguchi statistical method following the suspension prep for YSZ preparation. Since the goal of YSZ layer preparation is to achieve the highest adhesion and coating thickness, the signal-to-noise ratio (S/N) was used to determine the optimal values of temperature (T), time (t), concentration (C), and degree of grinding, as shown in table 4 and figure 2. These values were determined using the Taguchi design (L9) for thickness and adhesion measurement results of the YSZ layer. Table 1 demonstrates the optimal conditions of YSZ thickness of coating and adhesive for Ti alloys when Dip coating is used.
Analysis of YSZ deposition on commercially pure Ti
According to table 2, commercially pure Ti can generate a wide range of the thickness as well adhesion values with varying degrees of variability. The SNs ratio thesis (larger is superior) indicates that the experiment via the highest SNs ratio value has implicitly higher quality. The thickness and adherence of YSZ layer coatings were determined using the specified Taguchi method. Sample 9 has larger values for thickness, adherence, and SNS ratio, as shown in table 2. Experiment (9) yielded the greatest thickness (60 µm) with 60 Temp, 15 sec, 15 % C, and 250 grain silica pulverize. As displayed in figures 1 and 2, the optimal conditions for forming the YSZ film are 60 °C, 10 seconds, 10 % C, and a silica pulverize of 250 grains.
The solution's effective particle dispersion from tables 3 and 4, it was determined that the temperature (37,14 %), time (31,83 %), degree of milling (3,20 %), and concentration (27,53 %) influence the thickness of the YSZ deposit layer the most. Figure 5 depicts a cross-section of nine YSZ coating samples. Temperature (63,81 %), time (4,81 %), their degree of grinding (10,92 %), along with concentration (20,46 %) are listed in tables 5 and 6. For YSZ adhesion. Figure 6 depicts the removal area for YSZ layers of coating for pure commercial Ti.
|
Table 2. Signal-to-noise (S/N) ratio for commercial Ti alloy |
||||||||||
|
|
Temp |
T |
C |
D |
Th. |
Ad. |
SRNA1 |
MEAN1 |
SRNA2 |
MEAN2 |
|
1 |
30 |
5 |
10 |
250 |
34 |
16,24 |
30,6296 |
34 |
-4,211 |
16,24 |
|
2 |
30 |
10 |
15 |
280 |
37 |
30,90 |
31,3640 |
37 |
-9,799 |
30,90 |
|
3 |
30 |
15 |
20 |
400 |
28 |
36,58 |
28,9432 |
28 |
-1,264 |
36,58 |
|
4 |
45 |
5 |
15 |
400 |
33 |
19,33 |
30,3703 |
33 |
-5,724 |
19,33 |
|
5 |
45 |
10 |
20 |
250 |
44 |
22,59 |
32,8691 |
44 |
-7,078 |
22,59 |
|
6 |
45 |
15 |
10 |
280 |
56 |
22,10 |
34,9638 |
56 |
-6,887 |
22,10 |
|
7 |
60 |
5 |
20 |
280 |
32 |
15,93 |
30,1030 |
32 |
-4,044 |
15,93 |
|
8 |
60 |
10 |
10 |
400 |
62 |
5,76 |
35,8478 |
62 |
-5,208 |
5,76 |
|
9 |
60 |
15 |
15 |
250 |
60 |
7,87 |
35,5630 |
60 |
-7,919 |
7,87 |
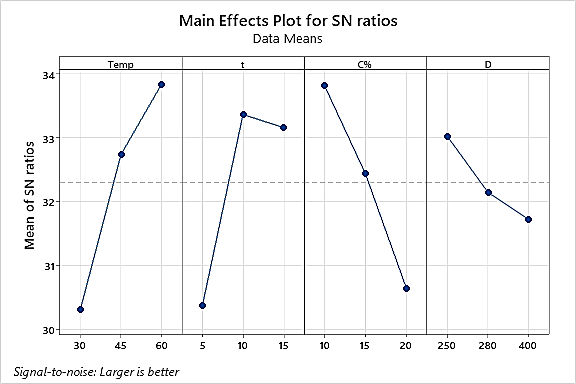
Figure 1. S/N ratio for thickness (commercial Ti)

Figure 2. S/N ratio Adhesion (commercial Ti)
Response Table for Signal to Noise Ratios
|
Table 3. Rank of controlled factors for thickness of the YSZ layer for commercial pure Ti |
||||
|
Level |
Temp |
t |
C % |
D |
|
1 |
30,31 |
30,37 |
33,81 |
33,02 |
|
2 |
32,73 |
33,36 |
32,43 |
32,14 |
|
3 |
33,84 |
33,16 |
30,64 |
31,72 |
|
Delta |
3,53 |
2,99 |
3,18 |
1,30 |
|
Rank |
1 |
3 |
2 |
4 |
|
Table 4. ANOVA for the thickness Of YSZ layer for Commercial pure Ti |
||||
|
Source |
DF |
Adj SS |
Adj MS |
Contribution |
|
Temp |
2 |
513,56 |
256,78 |
37,14 % |
|
t |
2 |
440,22 |
220,11 |
31,83 % |
|
C |
2 |
384,89 |
192,44 |
27,83 % |
|
D |
2 |
44,22 |
22,11 |
3,20 % |
|
Error |
0 |
|
|
|
|
Total |
8 |
1382,89 |
|
100 % |
|
Table 5. Rank of controlled factors for Adhesion of the YSZ layer for commercial pure Ti |
||||
|
Level |
Temp |
t |
C % |
D |
|
1 |
-28,43 |
-24,66 |
-22,10 |
-23,07 |
|
2 |
-26,56 |
-24,03 |
-24,48 |
-26,91 |
|
3 |
-19,06 |
-25,36 |
-27,46 |
-24,07 |
|
Delta |
9,37 |
1,33 |
5,36 |
3,84 |
|
Rank |
1 |
4 |
2 |
3 |
|
Table 6. ANOVA for the Adhesion of YSZ layer for Commercial pure Ti |
||||
|
Source |
DF |
Adj SS |
Adj MS |
Contribution |
|
Temp |
2 |
500,99 |
250,49 |
63,81 % |
|
t |
2 |
37,76 |
18,88 |
4,81 % |
|
C % |
2 |
160,67 |
80,33 |
20,46 % |
|
D |
2 |
85,66 |
42,83 |
10,92 % |
|
Error |
0 |
|
|
|
|
Total |
8 |
785,08 |
|
100 % |
Analysis of YSZ deposition on Ti-13Zr-13Nb
According to table 7, a wide range of thickness along with adhesion values of Ti-13Zr-13Nb were manufactured with varying degrees of variability. The SNs percentage theory demonstrates that an experiment with the largest SNs ratio value has implicitly higher quality. The thickness and adhesive of YSZ layer coatings were determined using the specified Taguchi method. Table 7 reveals that sample 9 has greater thickness, adherence, and SNS ratio values. Experiment (9) with 60 Temp, 15 sec, 15 % C, and a silica pulverize of 250 grains produced the greatest thickness (73 µm). As shown in figures 3 and 4, the optimal conditions for producing the YSZ layer were 60 °C, 10 seconds, 15 % C, and 400 grain silica pulverize. The solution's effective particle dispersion Temperature (46,47 %), time (16,66 %), degree of pulverizing (13,12 %), and concentration (23,75 %), as shown in table (8, 9). Are the variables that have the greatest effect on the thickness of the YSZ deposit layer. Figure 7 depicts a cross-section of nine YSZ coating samples. Temp (79,38 %), time (2,44 %), degree of grinding (16,93 %), and concentration (1,79 %) are listed in tables 10 and 11, For YSZ adhesion. Figure 8 depicts the elimination area of Ti-13Zr-13Nb YSZ coating layers.
|
Table 7. Signal-to-noise (S/N) ratio for Ti-13Zr-13Nb alloy |
||||||||||
|
|
Temp |
T |
C |
D |
Th. |
Ad. |
SRNA1 |
MEAN1 |
SRNA2 |
MEAN2 |
|
1 |
30 |
5 |
10 |
250 |
47 |
26,81 |
33,4420 |
47 |
-8,565 |
26,81 |
|
2 |
30 |
10 |
15 |
280 |
44 |
29,93 |
32,8691 |
44 |
-9,522 |
29,93 |
|
3 |
30 |
15 |
20 |
400 |
50 |
18,26 |
33,9794 |
50 |
-5,230 |
18,26 |
|
4 |
45 |
5 |
15 |
400 |
47 |
18,98 |
33,4420 |
47 |
-5,565 |
18,98 |
|
5 |
45 |
10 |
20 |
250 |
34 |
26,37 |
30,6296 |
34 |
-8,422 |
26,37 |
|
6 |
45 |
15 |
10 |
280 |
47 |
28,67 |
33,4420 |
47 |
-9,148 |
28,67 |
|
7 |
60 |
5 |
20 |
280 |
43 |
10,94 |
32,6694 |
43 |
-0,780 |
10,94 |
|
8 |
60 |
10 |
10 |
400 |
67 |
7,88 |
36,5215 |
67 |
-7,930 |
7,88 |
|
9 |
60 |
15 |
15 |
250 |
73 |
8,28 |
37,2665 |
73 |
-8,360 |
8,28 |

Figure 3. S/N ratio for thickness (Ti-13Zr-13Nb)

Figure 4. S/N ratio for Adhesion (Ti-13Zr-13Nb)
Response Table for Signal to Noise Ratios
|
Table 8. Rank of controlled factors for thickness of the YSZ layer for Ti-13Zr-13Nb |
||||
|
Level |
Temp |
time |
C |
D |
|
1 |
33,43 |
33,18 |
34,47 |
33,78 |
|
2 |
32,50 |
33,34 |
34,53 |
32,99 |
|
3 |
35,49 |
34,90 |
32,43 |
34,65 |
|
Delta |
2,98 |
1,71 |
2,10 |
1,65 |
|
Rank |
1 |
3 |
2 |
4 |
Response Table for Signal to Noise Ratios
|
Table 10. Rank of controlled factors for Adhesion of the YSZ layer for Ti-!3Zr-13Nb |
||||
|
Level |
Temp |
t |
C |
D |
|
1 |
-27,77 |
-24,97 |
-25,22 |
-25,12 |
|
2 |
-27,71 |
-25,29 |
-24,48 |
-26,48 |
|
3 |
-19,02 |
-24,25 |
-24,81 |
-22,91 |
|
Delta |
8,75 |
1,05 |
0,73 |
3,57 |
|
Rank |
1 |
3 |
4 |
2 |
|
Table 11. ANOVA for the Adhesion Of YSZ layer Ti-13Zr-13Nb |
||||
|
Source |
DF |
Adj SS |
Adj MS |
Contribution |
|
Temp |
2 |
499,65 |
249,825 |
79,38 % |
|
t |
2 |
15,36 |
7,682 |
2,44 % |
|
C |
2 |
11,26 |
5,632 |
1,79 % |
|
D |
2 |
103,18 |
51,590 |
16,39 % |
|
Error |
0 |
|
|
|
|
Total |
8 |
629,46 |
|
100 % |
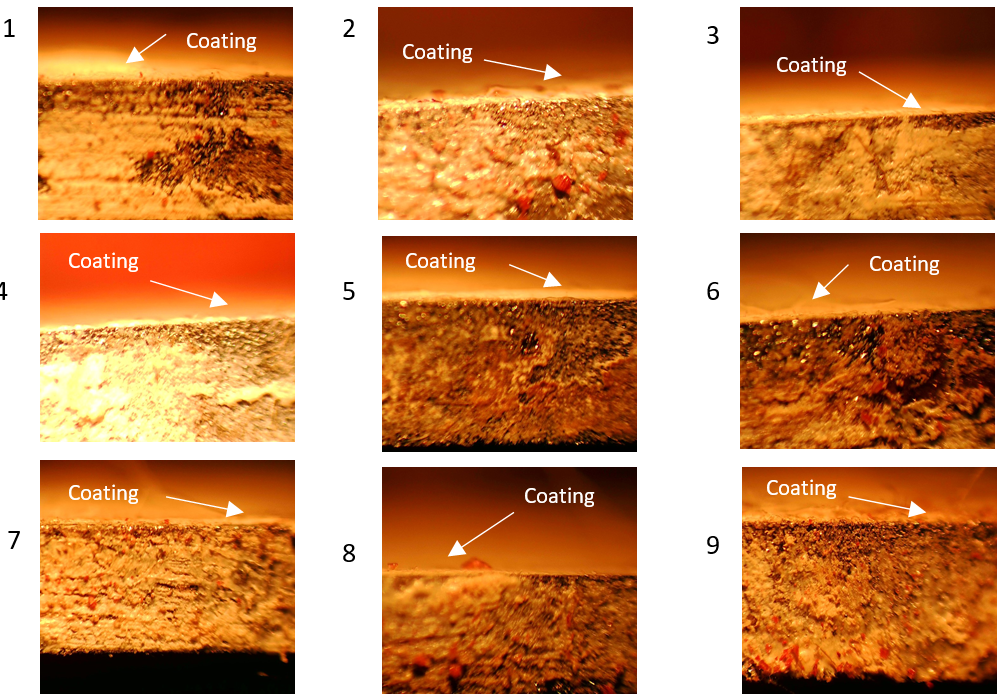
Figure 5. Show the YSZ coat layer on a cross section of commercial pure Ti specimens (10X)
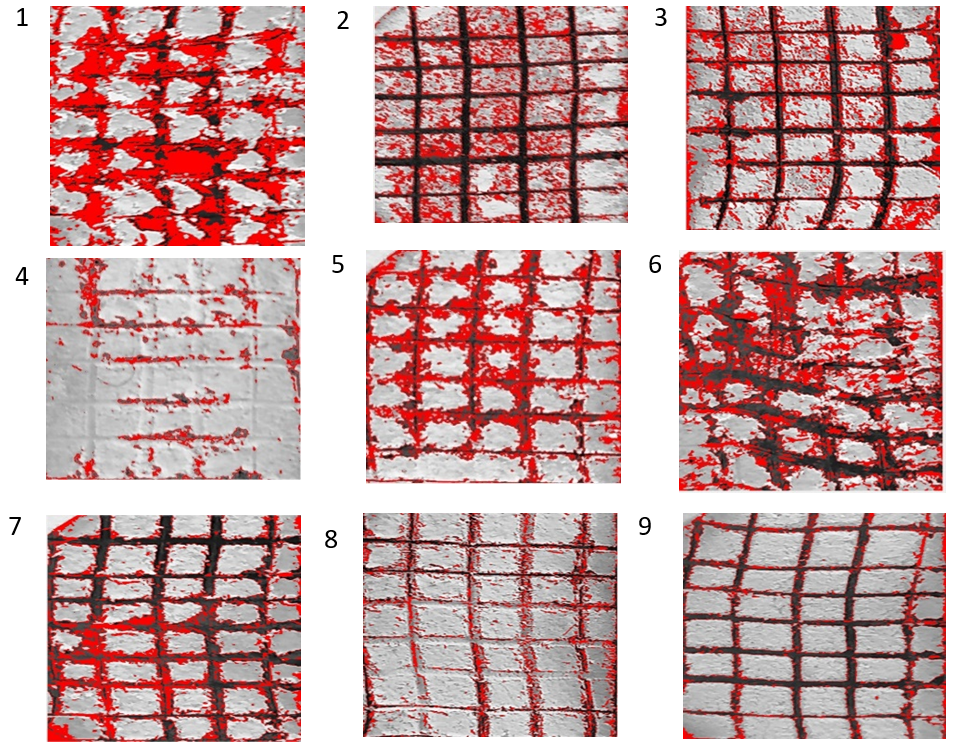
Figure 6. Area from YSZ coating layer removal for commercially pure Ti

Figure 7. Show the YSZ coating layer on cross section of specimens. For Ti-13Zr-13Nb (10X)

Figure 8. Removal area of YSZ coating layers for Ti-13Zr-13Nb
Corrosion Results
The OCP-time measurements of the optimal YSZ coatings on the Cp-Ti and Ti-13Zr-13Nb the measurement of potential versus time for optimized coatings are employed to comprehend the electrochemical aspects of corrosion behavior. Potentiodynamic curves for polarization of Ti-13Nb-13Zr, CP-Ti, and YSZ-coated Ti-13Nb-13Zr as well as CP-Ti alloys in just-prepared simulated body fluids (SBF) at 37 °C.
The corrosion current (ICorr) was calculated by extrapolating the anodic and cathodic portions of the curves of polarization to the corrosion potential (figure 10). The corrosion density of the current, corrosion potential, as well as corrosion rate (mpy) are shown in table 12. Titanium's corrosion rate diminishes significantly when the optimal coating has been applied to the surface, and the rate of corrosion of Ti-13Zr-13Nb coated with YSZ is lower than that for CP-Ti coated with YSZ. Figures 11 (a) and (b) illustrate the cyclic polarization of YSZ-coated Ti-13Zr-13Nb and CP-Ti alloys, respectively. In implant applications, its extremely reduced corrosion rate is crucial because it results in negligible release of deleterious metallic ions into the surrounding tissues.
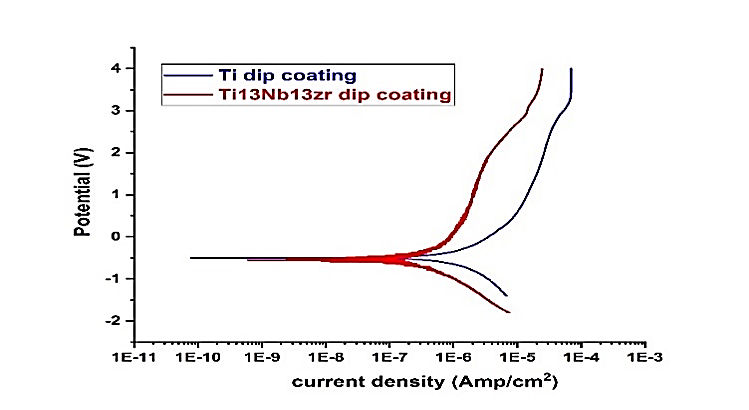
Figure 9. Polarization curves of coated Ti-13Zr-13Nb and CP-Ti
|
Table 12. shows the corrosion current density, corrosion potential and corrosion rate (mpy) |
||||||
|
OCP (volt) |
βc |
βa |
Corr. Rate (mmpy) |
I corr. (Amp.) |
E corr. (volt) |
ITEM |
|
-0,423 |
0,197 |
0,220 |
1,042× 10-2 |
4,612 × 10-7 |
-0,497 |
CP-Ti coated YSZ |
|
-0,365 |
0,187 |
0,185 |
5,417× 10-3 |
2,362 × 10-7 |
-0,547 |
Ti13Nb coated YSZ |

Figure 10. Cyclic polarization curves of :(a) YSZ coated CP-Ti (b) YSZ coated Ti-13Zr-13Nb alloy
Surface morphology
The FE-SEM images used for commercial pure Ti and Ti-13Zr-13Nb alloys on both coated samples showed the formation of a uniform dense coating devoid of fractures and nearly the same size of particles for the coated layers, as shown in figures 11 and 12. The EDS chemical evaluation of the coated CP-Ti alloy while coated Ti-13Zr-13Nb alloy using an YSZ layer is depicted in figures 13(a) and 13(b), respectively. Figure 14 (a) and (b) depict, respectively, the outcomes of a phase investigation of the optimum coatings for Ti-13Zr-13Nb (pre- and post-coating). The crystalline structure and phase properties of nano-YSZ are determined using X-ray diffraction (XRD) research. The both alloys were coated by YSZ were found almost similar in all peaks. The X-ray diffraction (XRD) pattern of ZrO2 exhibits distinct diffraction peaks at five specific values, about 28,12°, 29,81°, 31,42°, 50,01°, and 59,34°. These peaks have been identified as m (-111), t (101), m (110), t (200), and t (211), respectively, indicating the presence of tetragonal and monoclinic phases of zirconia. In the context of composites as shown in table 13, the degree of intensity of peaks often emerged as a significant factor of interest. The presence of crystalline boundaries and the inherent crystalline structure strongly influence the stability of suspensions and the creation of dense films.
The confirmation of zirconium dioxide's existence is supported by the diffraction peaks seen at specific 2θ values, as presented in table 13. This chemical composition corresponds well with that of the utilized alloy. The hydrophobicity or wettability of coated Titanium alloy specimens is measured with a constant trickle of distilled water by determining the solid and liquid interaction angles with CCD camera-equipped optical contact angle equipment. As shown in figure 15, the contact angles for coated while uncoated commercial pure Ti were 64,867° and 117,484°, respectively, whereas for Ti-13Nb-13Zr, the contact angles for coated and uncoated substrates were 34,543° and 94,599°, indicating that coated surfaces tend to be more hydrophilic.
It is proposed that hydrophilic surfaces are more preferable than hydrophobic ones.(26,27) In vitro research carried out by Rausch-Fan et al. while Zhao et al. demonstrates that the hydrophilic character of titanium surfaces substantially affects the differentiation of cells and growth element production.(28,29) In addition, animal investigations have demonstrated that osseointegration can be initiated early on hydrophilic surfaces.(30,31,32,33)
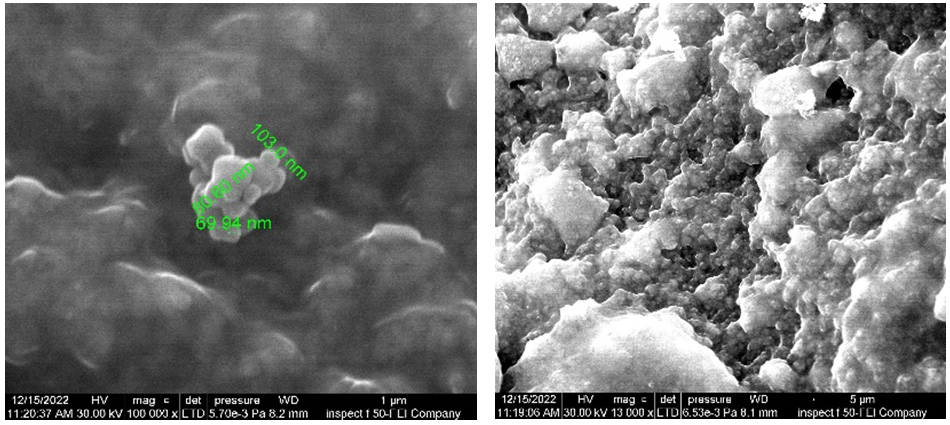
Figure 11. FE-SEM of YSZ for Ti-13Zr-13Nb

Figure 12. FE-SEM of YSZ for commercial pure Ti

Figure 13. Shows the EDS of (A)YSZ coated Cp Ti (B) YSZ coated Ti-13Zr-13Nb
|
Table 13. XRD analysis |
|||||
|
Peak no. |
2θ |
Material |
Phase |
hkl |
ICDD |
|
1 |
24,10 |
ZrO2 |
monoclinic |
110 |
37-1484 |
|
2 |
28,12 |
ZrO2 |
monoclinic |
-111 |
37-1484 |
|
3 |
29,81 |
ZrO2 |
tetragonal |
101 |
42-1164 |
|
4 |
31,42 |
ZrO2 |
monoclinic |
111 |
37-1484 |
|
5 |
34,81 |
ZrO2 |
tetragonal |
110 |
42-1164 |
|
6 |
40,69 |
ZrO2 |
monoclinic |
112 |
37-1484 |
|
7 |
50,01 |
ZrO2 |
tetragonal |
200 |
42-1164 |
|
8 |
55,38 |
ZrO2 |
monoclinic |
310 |
37-1484 |
|
9 |
59,34 |
ZrO2 |
tetragonal |
211 |
42-1164 |
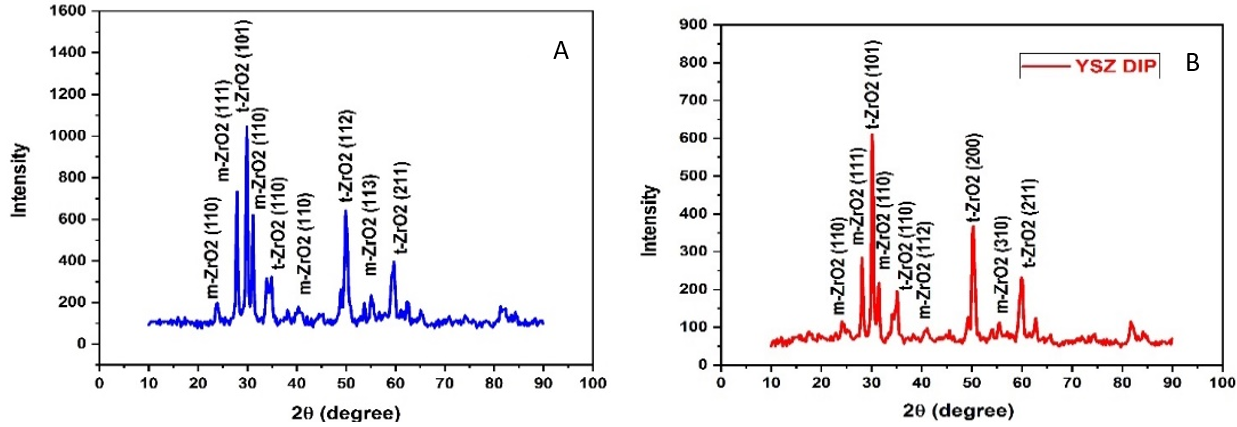
Figure 14. a) XRD for CP TI after coated by YSZ. b) XRD for Ti-13Zr-13Nb after coated by YSZ

Figure 15. Water contact angle measurement
The surface roughness has a significant effect on the cellular responses (i.e., growth, differentiation, and adherence) for implanting the outer layer; it is also defined as the irregularities in the surface profile, including troughs and peaks (figure 16). It has been measured with a micrometer device, and the nano-roughness during coating layers has been studied with AFM (table 14).
|
Table 14. roughness measurement by micrometer and AFM |
||
|
Micrometer |
AFM nano-scales |
Samples |
|
6,422 µm |
106,4 Nm |
Commercial pure Ti coated by YSZ |
|
4,781 µm |
65,00 Nm |
Ti-13Zr-13Nb coated by YSZ |

Figure 16. AFM images show topographies of (A)Ti-13Zr-13Nb, (B) cp-Ti
CONCLUSIONS
The YSZ coating was effectively deposited by dip coating on Ti-13Zr-13Nb as well as Cp-Ti titanium alloys; the adhesion and thickness values determine the optimal conditions for dip coating YSZ coated on the Ti-13Zr-13Nb as well Cp-Ti alloys. the optimal conditions for forming the YSZ layer for Cp-Ti alloy were determined to be 60 °C, 10 seconds, 10 % C, and 250 degrees of grinding, the optimal conditions to depositing the YSZ layer for the Ti-13Zr-13Nb alloy were found to be 60 °C, 10 seconds, 15 % C, and 400 degrees of grinding.
Observing the microstructure of the examined samples revealed that the YSZ layer to Cp-Ti as well Ti-13Zr-13Nb alloys is dense and homogeneous. and a coating layer that is continuous on the alloy substrate, water contact angle measures for samples revealed the value of the YSZ coating surface angle is 34,543° for highly hydrophilic coated Ti-13Zr-13Nb alloys, compared to 64,867° for coated Cp-Ti alloy.
AFM surface morphology analysis indicates that the surface roughness of coated Ti-13Zr-13Nb alloys is lower than that of coated Cp-Ti alloys, both coated alloys Cp-Ti as well Ti-13Zr-13Nb enhanced corrosion resistance in Ringer's solution at 37°C, with the coated Ti-13Zr-13Nb alloy exhibiting greater corrosion resistance compared with the coated Cp-Ti alloys.
REFERENCES
1. Souza, J.C.M.; Sordi, M.B.; Kanazawa, M.; Ravindran, S.; Henriques, B.; Silva, F.S.; Aparicio, C.; Cooper, L.F.Nano-scale modification of titanium implant surfaces to enhance osseointegration. Acta Biomater. 2019, 94,112–131.
2. K. Wang, D. Xiong, Y. Deng, Y. Niu, Ultra-lubricated surface of Ti6Al4V fabricated with combination of porous TiO2 layer, ultra-high molecular weight polyethylene film and hydrophilic polymer brushes, Mater. Des. 114 (2017) 18–24, https://doi.org/10.1016/j.matdes.2016.10.032.
3. S. Ghosh, S. Abanteriba, Status of surface modification techniques for artificial hip implants, Sci. Technol. Adv. Mater. 17 (2016) 715–735, https://doi.org/10.1080/14686996.2016.1240575.
4. J.B. Park, Bioceramics: Properties, Characterizations, and Applications, Springer Verlag, 2008, p. 192.
5. Khodaei, M.; Hossein Kelishadi, S. The e_ect of di_erent oxidizing ions on hydrogen peroxide treatment of titanium dental implant. Surf. Coat. Technol. 2018, 353, 158–162.
6. Ebrahimi, H. Esfahani, A. Fattah-alhosseini, O. Imantalab, In-vitro electrochemical study of TiB/TiB2 composite coating on titanium in Ringer’s solution, J. Alloys Compd. 765 (2018) 826–834, https://doi.org/10.1016/j.jallcom.2018.06.312.
7. Y. S. Tian, C. Z. Chen, S. T. Li, Q. H. Huo, Research progress on laser surface modification of titanium alloys, Appl. Surf. Sci. 242.1 (2005) 177-184.
8. Guleryuz, H., and H. Cimenoglu, Surface modification of a Ti–6Al–4V alloy by thermal oxidation, Surf. Coat. Technol. 192.2 (2005) 164-170
9. J. Guo, R.J. Padilla, W. Ambrose, I. J. De Kok, L.F. Cooper, The effect of hydrofluoric acid
10. Treatment of TiO2 grit blasted titanium implants on adherent osteoblast gene expression in vitro and in vivo, Biomaterials 28.36 (2007) 5418-5425.
11. H.W. Kim, H. E. Kim, and J. C. Knowles, Fluor-hydroxyapatite sol–gel coating on titanium
12. Substrate for hard tissue implants, Biomaterials 25.17 (2004) 3351-3358.
13. Ewald, S. K Glückermann, R. Thull and U. Gbureck, Antimicrobial titanium/silver PVD
14. Coatings on titanium, Biomed. Eng. Online 5.1 (2006) 22.
15. S. Varanasi, J. Ni, and D. M. Nelson, chemical vapor deposition process for depositing a titanium oxide coating, U.S. Patent No. 20,160,076,144. 17 Mar. 2016.
16. X. Liu, P. K. Chu, and C. Ding, Surface modification of titanium, titanium alloys, and relatedmaterials for biomedical applications, Mater. Sci. Eng. R. 47.3 (2004) 49-121.
17. Y. Bin, M. Mahjouri-Samani, C. M. Rouleau, D. B. Geohegana and K. Xiao, Low Temperature Synthesis of Hierarchical TiO2 Nanostructures for High Performance Perovskite Solar Cells, Phys. Chem. Chem. Phys. 18 (2016) 27067-27072.
18. K.S. Brammer, C. J. Frandsen, and S. Jin, TiO2 nanotubes for bone regeneration, Trends. Biotechnol. 30.6 (2012) 315-322.
19. S. Khorshidi, A. Solouk, H. Mirzadeh, S. Mazinani, J.M. Lagaron, S. Sharifi, S. Ramakrishna, A review of key challenges of electrospun scaffolds for tissue‐engineering applications, J. Tissue. Eng. Regen. Med. 10 (9) (2015) 715-738.
20. J. Ik Lim, B. Yu, K. Mi Woo, Y. Lee, Immobilization of TiO2 nanofibers on titanium plates for implant applications, Appl. Surf. Sci. 255.5 (2008) 2456-2460.
21. C. Dumitriu, A.B. Stoian, I. Titorencu, V. Pruna, V.V. Jinga, R.M. Latonen, J. Bobacka, I. Demetrescu, Electrospun TiO2 nanofibers decorated Ti substrate for biomedical application, Mater. Sci. Eng. C. 45(2014) 56-63.
22. X.Q. Cao,R.Vassen,S. Stöver, Ceramic-materials for thermal barrier coatings,J.Eur.Ceram.Soc.24(2004)1–10.
23. W.R. Chen,X.Wu,B.R.Marple,R.S.Lima,P.C. Patnaik,Pre-oxidation and TGO growth behavior of an air-plasma-sprayed thermal barrier coating,Surf.Coat.Technol.202(2008)3787–3796.
24. L. Besra, M. Liu, Prog. Mater. Sci. 52 (2007) 1.
25. J. Antony, F.J. Antony, Work Study 50 (2001) 141.
26. R.K. Roy, A Primer on the Taguchi Method, Society of Manufacturing Engineers, The United States of America, 1990.
27. F. Pishbin, A. Simchi, M.P. Ryan, A.R. Boccaccini, J. Eur. Ceram. Soc. 30 (2010) 2963.
28. P. Nledengvist, S. Hogmark, Experiences from scratch testing of tribological PVD coatings, Tribol. Int. 30 (7) (1997) 507–516.
29. M. Goudarzi, F. Batmanghelich, A. Afshar, A. Dolati, G. Mortazavi, Development of electrophoretically deposited hydroxyapatite coatings on anodized nanotubular TiO2 structures: corrosion and sintering temperature, Appl. Surf. Sci. 301 (2014) 250–257.
30. S. Mahmoodi, L. Sorkhi, M. Farrokhi-Rad, T. Shahrabi, Electrophoretic deposition of hydroxyapatite–chitosan nanocomposite coatings in different alcohols, Surf. Coat. Technol. 216 (2013) 106–114.
31. A.A. Abdeltawab, M.A. Shoeib, S.G. Mohamed, Electrophoretic deposition of hydroxyapatite coatings on titanium from dimethylformamide suspensions, Surf. Coat. Technol. 206 (2011) 43–50.
32. Molaei, M. Yari,M.R. Afshar, Investigation of halloysite nanotube content on electrophoretic deposition (EPD) of chitosan-bioglass-hydroxyapatite-halloysite nanotube nanocomposites films Appl. Clay Sci. 135 (2017) 75–81.
33. M. Farrokhi-Rad, S.K. Loghmani, T. Shahrabi, S. Khan mohammadi, Electrophoretic deposition of hydroxyapatite nanostructured coatings with controlled porosity, J. Eur. Ceram. Soc. 34 (2014) 97–106.
FINANCING
The authors did not receive financing for the development of this research.
CONFLICT OF INTEREST
The authors declare that there is no conflict of interest.
AUTHORSHIP CONTRIBUTION
Conceptualization: Marwan B. Hussein, Ali M. Mustafa, Makarim H. Abdulkareem.
Data curation: Marwan B. Hussein, Ali M. Mustafa, Makarim H. Abdulkareem.
Formal analysis: Marwan B. Hussein, Ali M. Mustafa, Makarim H. Abdulkareem.
Research: Marwan B. Hussein, Ali M. Mustafa, Makarim H. Abdulkareem.
Methodology: Marwan B. Hussein, Ali M. Mustafa, Makarim H. Abdulkareem.
Drafting - original draft: Marwan B. Hussein, Ali M. Mustafa, Makarim H. Abdulkareem.
Writing - proofreading and editing: Marwan B. Hussein, Ali M. Mustafa, Makarim H. Abdulkareem.