Category: STEM (Science, Technology, Engineering and Mathematics)
Review
Flow Patterns Modeling over Spillway: Review Study
Modelización de patrones de flujo sobre aliviadero: Estudio de Revisión
Humam Khalid Ibrahim1 *, Ammar Hatem Kamel2,3 *
1Agriculture Directorate of Anbar. Iraq.
2University of Anbar, College of Engineering. Iraq.
3University of Anbar, Upper Euphrates Basin Developing Center. Iraq.
Cite as: Khalid Ibrahim H, Hatem Kamel A. Flow Patterns Modeling over Spillway: Review Study. Salud, Ciencia y Tecnología - Serie de Conferencias. 2024; 3:858. https://doi.org/10.56294/sctconf2024858
Submitted: 05-02-2024 Revised: 20-04-2024 Accepted: 13-06-2024 Published: 14-06-2024
Editor:
Dr.
William Castillo-González ![]()
Note: paper presented at the 3rd Annual International Conference on Information & Sciences (AICIS’23).
ABSTRACT
A spillway dam, constructed concurrently with concrete or masonry, is a vital infrastructure designed to provide the controlled release of surplus water that surpasses the dam’s storage capacity. Since the Ogee spillway is among the best and most well-known worldwide, it deserves study. Weir flow, inertia, and gravity are crucial in many open-channel applications. Consequently, hydraulic performance data between model and prototype structures are commonly scaled using Froude similitude. As the upstream head decreases in a weir flow, the surface tension and viscosity forces become more important, perhaps to the point where Froude scaling fails to achieve complete model-prototype similarity. Size-scale effects are responsible for various alterations to the head-discharge connection, the nappe trajectory, and air entrainment. Hydraulic parameters were explored in this work utilizing Flow3D software to find weir geometry optimization using the CFD method. In addition, this study attempted to evaluate flow on various parts of crested weirs in three different models.
Keywords: Hydraulic Modeling; Numerical Models; Ogee Spillway; Physical Models; Scale Effects.
RESUMEN
Un aliviadero de presa, construido simultáneamente con hormigón o mampostería, es una infraestructura vital diseñada para proporcionar la liberación controlada del excedente de agua que sobrepasa la capacidad de almacenamiento de la presa. El aliviadero Ogee es uno de los mejores y más conocidos en todo el mundo, por lo que merece ser estudiado. El flujo del vertedero, la inercia y la gravedad son cruciales en muchas aplicaciones de canal abierto. En consecuencia, los datos de rendimiento hidráulico entre estructuras modelo y prototipo se escalan comúnmente utilizando la similitud de Froude. A medida que la altura aguas arriba disminuye en un flujo de presa, las fuerzas de tensión superficial y viscosidad adquieren mayor importancia, quizás hasta el punto de que el escalado de Froude no consigue una similitud completa entre modelo y prototipo. Los efectos de la escala de tamaño son responsables de varias alteraciones en la conexión altura-descarga, la trayectoria de la napa y el arrastre de aire. En este trabajo se exploraron los parámetros hidráulicos utilizando el software Flow3D para encontrar la optimización de la geometría del vertedero mediante el método CFD. Además, este estudio intentó evaluar el flujo en varias partes de los vertederos de cresta en tres modelos diferentes.
Palabras clave: Modelación Hidráulica; Modelos Numéricos; Vertedero Ogee; Modelos Físicos; Efectos de Escala.
INTRODUCTION
International reports show that Iraq is one of the countries most affected by these changes, especially in water resources, so it has become crucial to rethink Iraq’s water resources management system in light of climate change’s global and national impacts. Development plans in any country are linked to the issue of water and energy when they’re sustainable and achieve the sustainable development goals approved by the United Nations within Vision 2030. Many of these goals are related to managing water resources and their provision in terms of quantity and quality, which requires the presence of many water facilities, such as dams and reservoirs. Creating the system’s design is crucial per safety rules and optimized to ensure efficient functioning, requiring clearance from relevant authorities. Dams and other hydraulic structures are dependable instruments for hydroelectric power production, flood control, water supply, and navigation. To safely transmit flood flow (more than the reservoir’s storage capacity) from the pool to downstream, dams sometimes include a hydraulic structure called a spillway.(1,2,3,4,5,6)
The spillway’s breadth is a major factor in the cost-benefit analysis and dam safety. Typically, a narrower spillway with a larger discharge would be less costly than a wider one with a moderate one. The narrow design of the spillway has resulted in intense flows over the spillway.(7) The inadequate spillway design of several dams throughout the globe has contributed to their collapse.(2,8) Inadequate spillways the sources we mentioned as the cause of failure for 20 dams out of 2570 occurrences recorded by the Civil and Environmental Engineering Department at Stanford University in the United States in 2008.(9) In Iraq, most structures are earth-fill dams. As a result, there is a great deal of impetus to set aside enough space to prevent flooding. Historically, hydraulic performance data collected from laboratory-scale physical models has informed most prototype weir and spillway designs. Although numerical modeling has come a long way, hydraulic models are still a valuable engineering tool for planning and improving complex hydraulic systems. Comparing a model to its reference design is essential for accurate prototyping. It is necessary to use a robust methodology and realize geometric, kinematic, and dynamical similarities. Reproducing the flow domain’s hydraulic architecture and boundary geometries at various scales yields a geometrically similar result. When all relevant forces have the same prototype-to-model force ratios (dynamic similitude), the fluid flow patterns in the model will be identical (i.e., have the same velocity and acceleration ratios). Free-surface flow similitude (i.e., Froude similitude) owes a great deal to gravity and inertia; however, viscous forces (i.e., Reynolds similitude) and surface tension (i.e., Weber similitude) may also play a role in the fluid dynamics of open channels. Model and prototype applications cannot maintain dynamic similitude using the same fluid (such as water) due to gravity, viscosity, and surface tension.(10,11,12) For this reason, it is advisable to conduct experiments at flow conditions that are little affected by viscosity and surface tension to provide model-scale hydraulic performance data for prototype application, following the principles of Froude scaling. The challenge, however, is in establishing such limits. Weir flow is influenced increasingly by surface tension and viscous forces as flow depths (and velocities) decrease. Model scale (low upstream head conditions) viscous and surface tension effects tend to inflate Froude-scaled prototype heads for the same scale-equivalent discharge (Q).(13,14) Limiting upstream head requirements was proposed by Bretschneider to prevent large-scale impacts on head-discharge relationships and downstream jet trajectories for different weir crest shapes. Bretschneider claims in(10,12,13,15) that if the overflow head is more than 0,02 m in a physical scale model, the resulting discharge coefficient may be used directly on the appropriate prototype.(11) To learn more about the spillway’s design operating range, you should provide a minimum head of 0,075 m.(12) Earlier research shows that to replicate the nappe form over a sharp-edged notch, a head size of at least 0,04 to 0,06 m is necessary. Pfister et al.(13) found that for crest radii between 0,005 m and 0,3 m, the limiting head is 0,03 m, but the limiting criteria should be stricter for crest radii less than 0,005 m. The Ogee Spillway was recently developed from traditional labyrinth weirs.(16,17) Very little of the existing literature using scale models to examine discharge capacity has focused on the effects of scale the like,(17,18,19,20,21) data where the upstream head is below 0,03 or 0,05 m discards. Weber number > 50 denotes “sufficiently large” data; hence, only those will be used for this analysis. One prototype structure and three laboratory-scale models of ogee spillways were evaluated for their discharge characteristics so that I could learn more about the influence of surface tension and viscous effects on Froude-scale modeling of ogee spillways, as well as the minimum values of the upstream head (H) above which can consider these effects negligible. Taking the upstream water depth (h) about the weir crest and multiplying it by the velocity head (V2/2g) at the measurement point yields the total upstream head (H). Someone used H in this study to define the upstream head. However, the kinetic energy term or velocity head was frequently negligible compared to h. Therefore, h could substitute for H in most cases. The constant driving factor behind dam building across the globe is the requirement to offer equipment to ensure dependable water management and supply for various reasons. Dam safety estimates need a thorough risk analysis. Because of the importance of ensuring the public’s safety, engineers must pay close attention to detail at every stage of the dam-building process.(22) Using the Mandali Dam in Iraq as a case study, this research offers experts in dam and water resources engineering a summary of the key concepts and considerations for constructing the dam’s spillway and safety valve.
Crest Shape of Overflow Spillway
Figure 1 depicts the operation of the ogee spillway.(23) The United States Bureau of Reclamation has conducted substantial research on crest shapes.

Figure 1. Ogee Spillway(23)
Dividing the shape into two quadrants, upstream and downstream, from the highest point of the lower nappe surface is preferable. The upstream section describes a compound circular curve from the origin comprising numerous components. These components are a, b, r1 and r2. The upstream slope determines it. The downstream face divides into three zones: the crest origin, the spillway face, and the point of tangency (P.T). Equation 1 and figure 2 define the downstream part and other parameters.(24)
![]()
K and P are constants determined from table 1, and X and Y are the coordinates of the downstream spillway profile. Hd is the design head over the spillway crest. The upstream face slope, design head, and pool depth all influence these constants via their effects on the approach velocity.(25)

Figure 2. Ogee spillway profile(26)
|
Table 1. Spillway Components (H/V)(26) |
||||
|
Slope |
0/3 |
1/3 |
2/3 |
3/3 |
|
K |
2 |
1,939 |
1,939 |
1,873 |
|
P |
1,85 |
1,836 |
1,81 |
1,776 |
Figure 3 explains the details of Weir Crest for the model and spillway manufacturing. Someone can evaluate the efficiency of the spillway by measuring a parameter or quantitative variable known as the discharge coefficient (C). It stands for the losses in approach channels, such as those at the channel’s transition and entry and those due to upstream curvature. When calculating reservoir heights, these losses must be included in the overall head.(27) The ogee spillway profile has several shapes. These shapes depend on the spillway height (P), which is the elevation of the spillway crest above the floor, the head over the crested (Ha), and the inclination of the upstream face. Ogee spillway discharge over the crested may calculate by the general equation of discharge that is equation 2:(28)
![]()
To calculate the static head and approaching velocity head at the crest, we use the following formula: where Q is the discharge in (m3/s), C is the discharge coefficient, L is the effective length of the spillway in (m), and Ha is the total head at the crest, equation 3:
![]()

Figure 3. Flow parameters over spillway(26)
Discharge at a gated spillway’s partial opening may calculate using the same formula as flow through a low-head orifice, equation 4:
![]()
Where Cg is the discharge gating coefficient, D is the height of the gate opening in meters, L is the length of the spillway crest net, g is the acceleration of gravity, and H is the height between the top of the spillway and the center of the upstream head. The ideal shape or profile of the spillway should be close to the profile figure 2 or curve, which satisfies equation 1 for minimizing the pressure on the surface of the spillway. Caution should be applied to avoid the negative pressure on the spillway surface caused by the separation of the high-speed flow from the surface. This action can lead to a pounding action, causing significant damage to the spillway (e.g., pitting).(29)
Scale Effects in Hydraulic Physical Models
Scale effects are variations in flow behavior across models and prototypes that result from different force ratios at each scale. Physical representations are “approximate” because they only consider the relative strengths of the forces most salient to the event modeling.(12) Since this is the case, it is essential to check that the effects of parties with different ratios at the prototype and model are negligible. As the scale factor grows, so do the scale effects.(15) The free surface flows in hydraulic structures and open channels are primarily governed by gravity, with viscous and capillarity forces having a minimal impact and consequently being neglected. Therefore, many people rely on Froude’s Law of Similarity. The Froude number (Fr) is the ratio of the force of inertia to the influence of gravity, equation 5:
![]()
Where (𝑣, 𝑔, and ℎ) are, respectively, the speed, gravity, and depth of the water. This indicates that the Froude number, a dimensionless quantity, will be the same in the model and the prototype. Changes in viscosity and surface tension forces (assuming they are not insignificant in the model) will induce scale effects. Using the principle of geometric similitude, we can express the scale factor as Lm (representing the model’s characteristic length) divided by Lp (representing the prototype’s typical length) in equation 6 and equation 7. Model water velocity (vm) divided by corresponding prototype water velocity (vp) yields the velocity ratio (V.R.). Equation 8 establishes a connection between the Qm and Qp discharges in the model and prototype, respectively. Equation 9 means that the model time (Tm) and the actual time (Tp) are equivalent.

Table 2 shows the scale ratios according to Froude’s law, which can apply based on similarity principles.(30)
|
Table 2. The scale factor according to Froude number |
|
|
Parameter Scale Value |
Law of Scale |
|
Length |
Lr |
|
Velocity |
Vr = Lr0,5 |
|
Discharge |
Qr = Lr2,5 |
|
Time |
Tr = Lr0,5 |
|
Force |
Fr = Lr3 |
|
Pressure |
Pr = Lr |
Flow Pattern Modeling with Numerical Models
The complicated flow patterns over the spillway simulated using physical models for many years.(31) Small dam designs (less than 15 m high), such as dams in water harvesting projects in Iraq, incur a disproportionately high design cost due to the physical model. For instance, a physical model of the Al-Massad dam in Iraq would cost around 10 % of the overall cost of the dam to build and maintain.
Physical models have several drawbacks or constraints, including the high building cost, the need for extensive time and resources to complete the design process, and the impact of scale, which lead to the inability to capture the behavior of cavitation and surface tension. In the physical model, applying different scenarios is difficult or impossible for visualizing and understanding turbulent flows.(32,33,34,35,36,2,9) Therefore, we may quickly and cheaply investigate the behavior of flow-over spillways using the tool provided by the numerical model. The numerical model can display the flow process with the equation and the proper coefficient for analytical solutions under various conditions.
Because all hydraulic structures in Iraq develop using mathematical and physical models, there is no in-depth evaluation of the accuracy with which these models can simulate the characteristics of flow across ogee spillways.
The present study can provide a comprehensive overview of the importance of numerical models in dam design. Computational Fluid Dynamics (CFD) has recently developed to simulate fluid flow numerically.(37,38) With the advent of high-performance computers and the ongoing development of computational techniques, it has become possible to efficiently and effectively explore the hydraulic structure’s behavior numerically within a manageable time and money constraint.(39) Today, the CFD numerical models provide several solutions to design and operation problems test of the spillway.(40,41) Fast development of CFD has observed; eventually, one may use it to build a spillway without first subjecting one to costly and time-consuming laboratory testing to examine the effect of dams and similar hydraulic structures.(42) The performance of Fluent 2D and Flow 3D numerical models was studied by Ammar et al.(43) and Assim et al.(22,49) to model the movement of water over the Ogee Dam.
The numerical and experimental data have shown excellent agreement with computational fluid dynamics software. The scale effects between model and prototype predictions may be investigated and compared. There have been very few applications of this novel idea thus far. Consequently, a few studies in the literature analyze scale effects using CFD models. This conception is shown in Kim et al.(46), they conducted two-dimensional computational fluid dynamics (CFD) simulations to investigate the impact of size and roughness on weir velocity and pressure for an ogee spillway. Huang et al.(44) provide the results of an intriguing investigation in which 3D CFD was used to assess the effects of scale on turbulence modeling and sediment scour near a bridge pier. I performed physical model scale simulations and qualitative validation using physical model data in this research. The prototype scale was then numerically simulated, and the results were compared to the model scale predictions. Computational fluid dynamics simulations demonstrate that significant errors in calculating turbulence and scour near a large bridge pier might result from failing to fulfill Reynolds and Froude number similarity simultaneously. Differences in velocity that are significantly different across the two scales are also brought to light. Aldaş et al.(45) investigated the influence of scale on water jet pump models with equal Reynolds numbers at seven different scales. The efficiency of the pump is calculated at various levels of output. For a given scale, roughness and turbulence models were also examined. The research shows that CFD is an effective tool for enhancing the performance of these pumps. Pfister et al.(47) provide cutting-edge research on this thesis. This research included 2D simulations of a PKW with a cylinder-shaped crest at different radii. The rating curve and crest pressures were analyzed to see how the different scales affected them.
Minimal head over crest for minimizing scale effects in the rating curve was computed and found to agree with values given in the literature. At the lowest crest diameters, our research also shows that the pressure profiles at the weir crest are overestimated. Four cases are given above in which Computational Fluid Dynamics (CFD) is used to investigate the effects of scale on the flow through three different types of hydraulic structures and around a bridge pier. Two of these(46,47) are purely theoretical 2D simulations. Huang et al.(44) validate qualitatively, whereas Aldaş et al.(45) uses targeted stages in the process cycle to conduct model validation. Thus, an exceptional absence of research thoroughly examines the scale implications for a 3D situation by first validating the CFD predictions. Furthermore, no limits are developed to reduce the scale effects even when the CFD predictions are verified and scale effects are evaluated.
The performance of turbulence
The evaluation of the performance of turbulence closure models is studied by Ammar et al.(43) for flow pattern modeling for the Mandali dam in Iraq. Large eddy simulation (LES) models, the more common k-, RNG k-, and k- models, and others are all used to simulate the flow patterns over the spillway. Flow-3d and the Volume of Fluid (VOF) method affect the turbulence models and get their free surfaces. The research focused on how the turbulence closure models LES and RANS vary in their ability to forecast the flow pattern over the spillway. Four different discharge estimates used to simulate the flow over the spillway. The findings demonstrate that, compared to the RANS turbulence closure models, the LES turbulence model provides more accurate predictions. Unlike RANS models, LES models can accurately represent eddies and scales. There is little difference between models when comparing water speed and depth on chute runs. Otherwise, the pressure distribution and flow depth estimates for the k- and LES models were unstable over the stability basin. Finally, the modeling results demonstrated that the LES model is an effective tool for simulating spillway flow. Many academics have examined the numerical outputs of the CFD programs Ansys Fluent-2D and Flow-3D while modeling flow through a discharge channel to identify discrepancies between the programs’ performances. A study used the Random Number Generation (RNG) k- of the RANS method and followed the water-air interaction utilizing the volume of fluid (VOF) algorithm to combat turbulence. To evaluate the reliability of Fluent-2D and Flow-3D, we compare typical flow parameters (such as velocity, free surface profiles, pressure, and turbulent kinetic energy) as shown in figure 4.(43)

Figure 4. (a and b respectively) The velocity distribution and pressure distribution at the crest of the spillway compared using the Fluent-2D and Flow-3D software packages
I also compared the outputs of both algorithms against laboratory data. The study revealed excellent agreement between the data from the two platforms. I undertook a network sensitivity analysis to identify the optimal cell size for both programs. Despite some variation in pressure distribution along the stream, both models produced similar velocity distribution and flow depth results. In addition to a modest variance in the water level in the underlying basin, both models successfully determined the direct site of turbulent kinetic energy. Instead of depending on laboratory models, this publication advises engineers to do calibrations using both programs to check their results.(48) They sought to provide a numerical analysis of surface runoff on moving water. Using the finite FLUENT unit, a numerical model constructed that solves the RANS equations using a surface capture approach for external forecasting. It is common practice to use either a multiphase flow mixing model (MMF) or a volume of the fluid model (VOF) when analyzing a multiphase flow. Both theories may differentiate by their divergent stages and rates of development. All models simulated turbulence using the RNG k-model and the PISO computational method. The surface numerical model predicted the Mandali hydraulic spillway’s velocity distribution and discharge characteristics. The findings of the software operations were identical when compared to the laboratory data, with one minor change that has no substantial influence and may ignore. We used extensive comparisons between experimental data and the physical model of the Mandali discharge to validate the numerical model. Using Froude’s scaling principles, we convert the experimental data to prototype equivalents and compare them to the predictions of the numerical models. Discharge, surface height, and velocity distribution across the ogee stream were compared between the model and experimental measurements to verify the model’s accuracy (figure 5 and figure 6).(48) The classification curves included a wide range of upstream water levels. The VOF model predicted a discharge within 0,03 % for every upstream water level, and the MMF model predicted a burst within 0,05 %. These variances are most likely the result of numerical model approximations and modest inaccuracies in managing vertical water height due to the size of the spill zone at the inlet boundary.
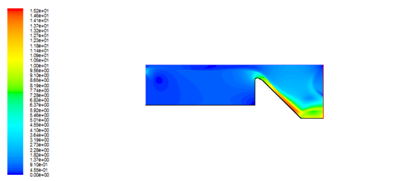
Figure 5. Velocity Distribution over Ogee Spillway

Figure 6. Contours of Pressure over Ogee Spillway
CONCLUSIONS
Physical modeling is the most often utilized technique in studying and developing hydraulic structures. Experimental methods are crucial in simulating and investigating poorly understood physical processes in controlled conditions. Computational flow dynamics (CFD) is an interdisciplinary area with many practical and theoretical applications; this page contains a comprehensive literature review on CFD’s foundations, applications, and turbulence models. Researchers utilize computational fluid dynamics (CFD) to study fluids (liquids or gases). These studies use elaborate mathematical calculations to learn about a system’s inner workings and how to optimize its performance. Computational fluid dynamics (CFD) has expanded considerably in recent years. Because of this, many companies now rely heavily on CFD in their analysis and design procedures. Numerical models such as CFD can better portray and predict the flow in various hydraulic structures than physical models. Many scenarios for the operation of hydraulic facilities, such as the spillways of large and small dams like the Haditha and Mandali Dams in Iraq, can be tested with a single numerical model, saving time and money over the construction of multiple physical models. Present research indicates that CFD programs have established themselves as de facto standard numerical models in design and development, providing engineers with accurate, efficient, and cost-effective tools.
BIBLIOGRAPHIC REFERENCES
1. Chinnarasri, C., Kositgittiwong, D., Julien, P.Y., 2014. Model of flow over spillways by computational fluid dynamics. Proc. Inst. Civ. Eng. - Water Manag. 167, 164–175. https://doi.org/10.1680/wama.12.00034.
2. Imanian, H., Mohammadian, A., 2019. Numerical simulation of flow over ogee crested spillways under high hydraulic head ratio. Eng. Appl. Comput. Fluid Mech. 13, 983–1000. https://doi.org/10.1080/19942060.2019.1661014
3. James, C.S., 2020. Hydraulic Structures, Hydraulic Structures. Springer International Publishing, Cham. https://doi.org/10.1007/978-3-030-34086-5
4. Peltier, Y., Dewals, B., Archambeau, P., Pirotton, M., Erpicum, S., 2018. Pressure and velocity on an ogee spillway crest operating at high head ratio: Physical model measurements and validation. J. Hydro-environment Res. 19, 128–136. https://doi.org/10.1016/j.jher.2017.03.002
5. Reese, A.J., Maynord, S.T., 1987. Design of Spillway Crests. J. Hydraul. Eng. 113, 476–490. https://doi.org/10.1061/(ASCE)0733-9429(1987)113:4(476)
6. Roushangar, K., Foroudi, A., Saneie, M., 2019. Influential parameters on the submerged discharge capacity of converging ogee spillways based on physical model study and machine learning-based modeling. J. Hydroinformatics 21, 474–492. https://doi.org/10.2166/hydro.2019.120
7. Ammar H.K, Ahmad I.R, 2021. Study the Numerical Modeling of Flow Patterns over Spillway.
8. Yusuf, F., Micovic, Z., 2020. Prototype-Scale Investigation of Spillway Cavitation Damage and Numerical Modeling of Mitigation Options. J. Hydraul. Eng. 146, 04019057. https://doi.org/10.1061/(ASCE)HY.1943-7900.0001671
9. Ho, D.K.H., Riddette, K.M., 2010. Application of computational fluid dynamics to evaluate hydraulic performance of spillways in Australia. Aust. J. Civ. Eng. 6, 81–104. https://doi.org/10.1080/14488353.2010.11463946
10. Kobus, H.E. (Ed.) (1980). Hydraulic modeling. Hamburg: Verlag Paul Parey.
11. Ettema, R., Arndt, R., Roberts, P., & Wahl, T. (2000). Hydraulic modeling : Concepts and practice. Reston, VI: American Society of Civil Engineers ASCE.
12. Novak, P., Guinot, V., Jeffrey, A., & Reeve, D.E. (2010). Hydraulic modeling : an introduction : principles, methods, and applications. London: Spon Press.
13. Pfister, M., Battisacco, E., De Cesare, G., & Schleiss, A.J. (2013). Scale effects related to the rating curve of cylindrically crested Piano Key weirs. In S. Erpicum, F. laugier, M.
14. Matthew, G. (1991). Higher order, one-dimensional equations of potential flow in open channels. ICE Proceedings 1991(2), 187–201.
15. Heller, V. (2011). Scale effects in physical hydraulic engineering models. Journal of Hydraulic Research 49(3), 293–306.
16. Lempérière F. & Ouamane, A. (2003). The Piano Key Weir: a new cost-effective solution for spillways. Hydropower & Dams, 5, 144-149.
17. Machiels, O., Erpicum, S., Dewals, B.J., Archambeau, P. & Pirotton, M. (2011). Experimental observation of flow characteristics over a Piano Key Weir. Journal of Hydraulic Research 49(3), 359-366.
18. Leite Ribeiro, M., Bieri, M., Boillat, J.-L., Schleiss, A., Singhal, G. & Sharma, N. (2012a). Discharge capacity of Piano Key Weirs. Journal of Hydraulic Engineering (ASCE), 138, 199-203.
19. Machiels, O., Pirotton, M., Archambeau, P., Dewals, B.J. & Erpicum, S. (2014). Experimental parametric study and design of Piano Key Weirs. Journal of Hydraulic Research 52(3), 326-335.
20. Pfister, M., Erpicum, S., Machiels, O., Schleiss, A. & Pirotton, M. (2012). Discharge coefficient for free and submerged flow over Piano Key Weirs. Journal of Hydraulic Research 50(6), 642-643.
21. Leite Ribeiro, M., Pfister, M., Schleiss, A. & Boilat, J.-L. (2012b). Hydraulic design of type Piano Key Weirs. Journal of Hydraulic Research 50(4), 400-408.
22. Assim M.L, Ammar H.K, Atheer S.A 2022. Study the modeling of the effects of hydraulic force on strain in hydraulic structures using ANN.
23. Kharagpur. (N.D.). “Hydraulic Structures for Flow Diversion and Storage”. Version 2 CE IIT.
24. Mays, L.W., 2010. Water resources engineering. John Wiley & Sons.
25. Coleman, H.W., Wei, C.Y., Lindell, J.E., 2004. Hydraulic design of spillways. Hydraul. Des. Handb. 17–41.
26. Noamam, Z.T., 2014. Effect of Al-Massad dam spillway location on the hydraulic Properties of the spillway.
27. Assim M.L, Ammar H.K, Atheer S.A 2021. Study the Modelling of Flow Patterns over Spillway with CFD.
28. Ho, D.K.H., Boyes, K.M., Donohoo, S.M., 2001. Investigation of spillway behavior under increased maximum flood by computational fluid dynamics technique, in 14th Australasian Fluid Mechanics Conference, Adelaide University, Adelaide, Australia.
29. Houghtalen, Robert J, A Osman, and Ned H C Hwang. 2016. Fundamentals of Hydraulic Engineering Systems. Prentice Hall New York, NY.
30. Assim M.L, Ammar H.K, Atheer S.A 2021. Study the hydrodynamic behavior of Haditha dam spillway under different conditions.
31. Erpicum, S., Tullis, B.P., Lodomez, M., Archambeau, P., Dewals, B.J., Pirotton, M., 2016. Scale effects in physical piano key weirs models. J. Hydraul. Res. 54, 692–698. https://doi.org/10.1080/00221686.2016.1211562
32. Al-Qadami, E.H.H., Abdurrasheed, A.S., Mustaffa, Z., Yusof, K.W., Malek, M.A., Ghani, A.A., 2019. Numerical modeling of flow characteristics over the sharp-crested triangular hump. Results Eng. 4, 100052. https://doi.org/10.1016/j.rineng.2019.100052
33. Fais, L.M.C.F., Genovez, A.I.B., 2009. Discharge Rating Curve and Scale Effects Correction in Morning Glory Spillways, in Advances in Water Resources and Hydraulic Engineering. Springer Berlin Heidelberg, Berlin, Heidelberg, pp. 2041–2046. https://doi.org/10.1007/978-3-540-89465-0_350
34. Salazar, F., San-Mauro, J., Celigueta, M.Á., Oñate, E., 2020. Shockwaves in spillways with the particle finite element method. Comput. Part. Mech. 7, 87–99. https://doi.org/10.1007/s40571-019-00252-1
35. UÇAR, M., KUMCU, Ş.Y., 2018. Comparison Of Physical Modeling And Cfd Simulation Of Flow Over Spillway In The Arkun Dam.
36. Yildiz, A., Yarar, A., Kumcu, S.Y., Marti, A.I., 2020. Numerical and ANFIS modeling of flow over an ogee-crested spillway. Appl. Water Sci. 10, 90. https://doi.org/10.1007/s13201-020-1177-4
37. Mohammed, J.R., Noori, B.M.A., Hussein, I.A., 2017. Modeling of The Hydraulic Performance of Ogee Spillway Using Computational Fluid Dynamics (CFD). J. Duhok Univ. 638–653.
38. Zeng, J., Zhang, L., Ansar, M., Damisse, E., González-Castro, J.A., 2017. Applications of Computational Fluid Dynamics to Flow Ratings at Prototype Spillways and Weirs. II: Framework for Planning, Data Assessment, and Flow Rating. J. Irrig. Drain. Eng. 143, 04016073. https://doi.org/10.1061/(ASCE)IR.1943-4774.0001113.
39. Sarwar, M.K., Ahmad, I., Chaudary, Z.A., Mughal, H.-U.-R., 2020. Physical model and numerical studies on orifice spillway aerator of Bunji Dam. J. Chinese Inst. Eng. 43, 27–36. https://doi.org/10.1080/02533839.2019.1676652
40. Maliki, A.Y., Musa, M.A., Ahmad, M.F., Zamri, I., Omar, Y., 2017. Comparison of numerical and physical model results for overtopping discharge of the OBREC wave energy converter. J. Eng. Sci. Technol 12, 1337–1353.
41. Runchal, A.K., 2012. The future of CFD and the CFD of the future. Comput. Therm. Sci. An Int. J. 4.
42. Al-Hashimi, S.A.M., Huda M. Madhloom, Rasul M. Khalaf, Thameen N. Nahi, Nadhir A. Al-Ansari, 2017. Flow over Broad Crested Weirs: Comparison of 2D and 3D Models. J. Civ. Eng. Archit. 11, 769–779. https://doi.org/10.17265/1934-7359/2017.08.005
43. Ammar H.K, Ahmad I.R, 2020. Performance Study of Fluent-2D and Flow-3D Platforms in the CFD Modeling of a Flow Pattern Over Ogee Spillway.
44. Huang, W., Yang, Q. and Xiao, H. 2009. CFD modeling of scale effects on turbulence flow and scour around bridge piers. Computers & Fluids, 38(5), pp.1050-1058.
45. Aldaş, K. and Yapıcı, R. 2014. Investigation of Effects of Scale and Surface Roughness on Efficiency of Water Jet Pumps Using CFD. Engineering Applications of Computational Fluid Mechanics, 8(1), pp.14-25.
46. Kim, D. G. and Park, J. H. 2005. Analysis of flow structure over ogee spillway in Consideration of scale and roughness effects by using CFD model. KSCE Journal of Civil Engineering, 9(2), pp.161-169.
47. Pfister, M., Battisacco, E., De Cesare, G. and Schleiss, A. J. 2013a. Scale effects related to the rating curve of cylindrically crested Piano Key weirs. In: Second International workshop on labyrinth and piano key weirs, Chatou, Paris, France.
48. Shaymaa AM.H.A, Riyadh Z.A, 2013. Study the numerical simulation of two-phase flow over Mandali Dam’s ogee spillway.
49. Assim M.L, Ammar H.K, Atheer S.A 2022. Study the Water Flow Simulation with Computational Fluid Dynamics (CFD).
FINANCING
No financing for the article.
CONFLICT OF INTEREST
The author declares that there is no conflict of interest in the work.
AUTHORSHIP CONTRIBUTION
Conceptualization: Humam Khalid Ibrahim, Ammar Hatem Kamel.
Data curation: Humam Khalid Ibrahim, Ammar Hatem Kamel.
Formal analysis: Humam Khalid Ibrahim, Ammar Hatem Kamel.
Methodology: Humam Khalid Ibrahim, Ammar Hatem Kamel.
Drafting - original draft: Humam Khalid Ibrahim, Ammar Hatem Kamel.
Writing - proofreading and editing: Humam Khalid Ibrahim, Ammar Hatem Kamel.